
- 2024 year-end: BENEFITS
Disability and leave of absence
Report objectives
This report aims to summarize the present metrics for our disability programs, assess the landscape of disability claim administration and litigation, and benchmark our patterns against comparable industry research.
data parameters
Our practice team uses JURIS and TAMS claims data to perform comparative analyses informed by their expertise and analytics. The data in this report is based on the calendar year, January through December, for each reporting year.Certain client data is excluded from book of business metrics to avoid overrepresentation of a single client.
Key observations
Short-term disability trends — around age, length of service and incident rates
In 2024, incident rates increased from 10.6 to 10.8, with rises in short-term disability claims among the 35-45 and 55+ age groups. Long-term employees, particularly those with 10 to 20 years of service, are experiencing higher levels of anxiety and stress, with anxiety being the primary mental health diagnosis at 50% in this group.
Leading diagnostic groups
Mental/substance claims continued to widen the gap between musculoskeletal claims as the leading non-pregnancy diagnostic group. Incident rates specific to mental health claims increased 4.3% year over year from 1.336 to 1.393 claims per 100. This outpaced the overall incident rate growth of 2.3%.
Claim durations and denials
From 2023 to 2024, the duration of claims increased across all age groups, with the 25-35 age group seeing the largest rise at 2%, primarily due to pregnancy and mental health diagnoses.
| • | In terms of length of service, the “less than 3 years” group saw a 4% increase; the “20+ years” group increased by 0.2% and had the highest average duration. |
| • | Additionally, closed claims rose by 5.1%, with mental health diagnoses like depression and anxiety showing significant increases in duration. |
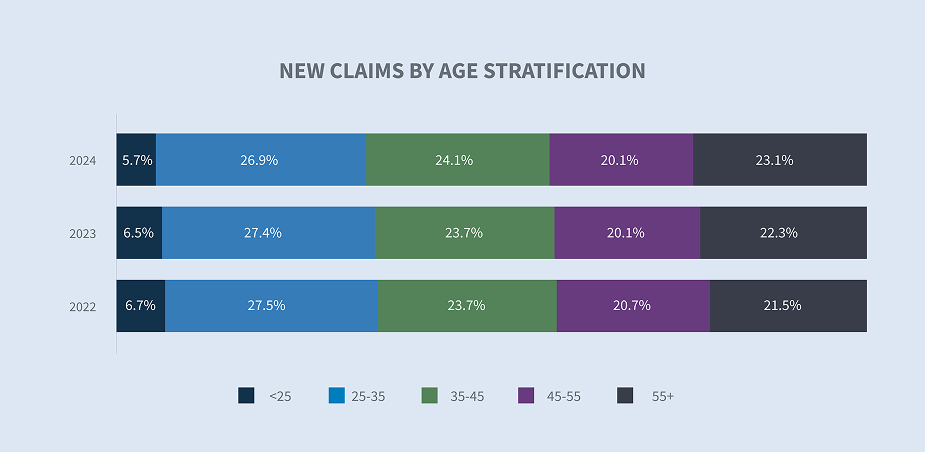
New cases by age showed that the 25-35 age group continued to make up the largest percentage, though it decreased by 1.7% from 2023 to 2024. In contrast, the 55+ age group increased from 16.47% in 2023 to 17.27% in 2024, a 4.9% rise.
Short-term disability
Incident rates by age
Incident rates by age range remained consistent, with an increase from 2023 to 2024 in all age groups except those under 25. Short-term disability claim volumes rose, particularly among the 25-35 and 55+ age groups. From 2023 to 2024, the 55+ age group saw a 5.9% increase, and the 35-45 age group experienced a 4.4% increase.

New claims by diagnosis
In 2024, pregnancy was the top diagnosis for new claims in the under 25, 25-35 and 35-45 age groups. For the 45-55 and 55+ age groups, musculoskeletal issues were the leading diagnosis for new claims. Mental health was the second highest diagnosis for all age groups except 55+, with 17% of new claims in the 35-45 age group. Anxiety accounted for 46% of mental health claims in 2024, a 4% increase from 2023. Anxiety was the primary diagnosis in mental health claims across all lengths of service, with the highest rate at 50% in the group with 10-20 years of service. In this group, depression accounted for 37% of claims, followed by other mental health disorders at 13%.


Closed claims
From 2023 to 2024, closed claims increased 5.1% and the average total approved days increased 1.9%. Excluding pregnancy, mental/substance was the top diagnosis code reasoning in 2024, increasing 3.8% from 2023. Looking at anxiety and depression, both diagnosis codes have increased in duration compared to the previous year ― depression increased by 4.5% and anxiety by 3.4%.


Total approved days
The duration by age showed a slight increase in every age group from 2023 to 2024, with the 25-35 age group having the largest increase at 2%. This age group had the highest volume of new claims related to pregnancy, but the second most common diagnosis was mental health and those durations increased year over year.

The duration by length of service shows stable numbers between 2023 and 2024, with increases in the “less than 3 years” and ” 20+ years” groups. The “less than 3 years” group increased by 4%, but their durations were the lowest on average compared to other groups. The “20+ years” group has the highest average duration, with a 0.2% increase from 2023 to 2024.


Denial reason
Short-term disability denial rates over the last three years showed an interesting trend. We saw a decline in denial rates due to no medical documentation but that was offset by denials due to the received medical not supporting the claim. Claims also showed a decrease in employees returning to work as a claim resolution, which was down from 82% in 2022 to 77% in 2024. As a result, we showed more claimants reaching plan exhaustion in 2024, which is up from the prior two years. This can be attributed to the increase in claims durations, especially among older workers.

Leave of absence
New volume
Leave of absence claims remained stable over the last three years in terms of overall volume. However, the trend we noted last year about the increase in leaves for care for family members continued to increase year over year and with the addition of four new statutory states in 2026, we expect this number to increase again next year.


Leave duration
Similar to short-term disability durations, leave of absence claim durations remained constant for employees under the age of 35 years old. Employees between 35-45 and 45-55 years old showed slight increases versus the prior year and the 55+ group continued to trend upwards in overall durations. We do not anticipate this to slow down for the 55+ group as trends show workers in this age group remaining in the workforce longer due to a variety of reasons.


Company paid leave
In our year-end reports for 2024, we have separated company paid leaves from statutory paid leaves as the volume of states that now require some type of statutory paid leave warranted its own report. Click here to see our observations in the 2024 year-end report on statutory paid leave.
The top overall benefit that is provided by employers is company paid parental leave followed by company family leaves.
Paid leave new volumes
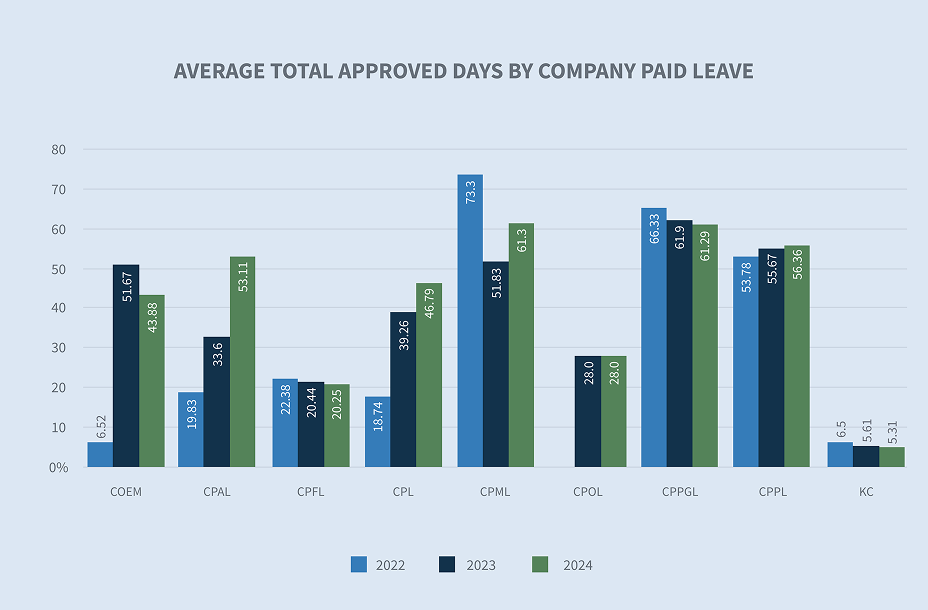
While paid parental leaves were the top company paid benefit by usage, company paid maternity benefits were tied with company paid miliary benefits for the longest duration at 61.3 days. Paid parental leave followed closely at 56.36 days and this continued to trend upwards as paid parental leave is now considered an essential benefit that employers should provide. While it is an essential benefit, plan designs continue to vary based on the employer’s size and industry. Given that these are the most popular company benefits, the highest usage was in the 25-35 and 35-45 age groups which aligned with disability and leave benefits relating to pregnancy and bonding claims.

See appendix for company paid leaves subcategories at the bottom of the chart.
See appendix for company paid leaves subcategories at the bottom of the chart.

Future considerations
Loper decision
The 2024 Loper decision is already having an impact as dozens of lawsuits have been filed challenging multiple regulatory interpretations. While this doesn’t undo past rulings, it is opening the door to allow past precedents to be re-evaluated. While benefit plans governed under the Employee Retirement Income Security Act have not been directly challenged, we do expect challenges to chip away at various regulatory agencies final rules such as the Mental Health Parity and Addiction Equity Act and others.
Political climate
With the change in administrations, we are already seeing the dramatic impact the Trump administration is having on the regulatory environment. The newly created Department of Government Efficiency (DOGE) has already impacted multiple regulatory agencies including the Department of Labor and Equal Employment Opportunity Commission. As of this article, over 40lawsuits have been filed as a result of decisions by DOGE and executive orders. We anticipate the federal instability will lead to greater regulation at the state level, which will cause even more confusion as the patchwork of state and local laws increase.

Aging workforce
Given the rising costs of living, trends across the country are showing that older workers are remaining in the workforce longer. If this trend continues, businesses could see additional pressure from added claims expenses as durations and benefits for claims will continue to increase. This could lead to frustration for younger workers who would historically move into the roles held by more senior employees as they retire. This frustration may also lead to more workers leaving for other opportunities, which could impact productivity and in turn lead to greater claims volume for workers who remain and feel pressured to take on additional tasks.

Appendix
