
- 2024 year-end: CASUALTY
Workers’ compensation
Report objectives
This report aims to summarize the present metrics for our workers’ compensation (WC) programs, assess the landscape of WC claims and litigation and benchmark our patterns against comparable industry research.
To aid our analysis, we utilized research from the following entities:
| • | National Council on Compensation Insurers (NCCI) |
| • | California Workers’ Compensation Insurance Rating Bureau (WCIRB) |
| • | Workers’ Compensation Research Institute (WCRI) |
data parameters
Our practice team uses JURIS claims data to perform comparative analyses informed by their expertise and analytics. The data in this report is based on both insured and self-insured claims for all states across five, 12-month periods (referred to as CY) from Jan. 1, 2020, through Dec. 31, 2024.
Key observations
Workers’ compensation (WC) claim volume stayed flat, increasing 0.3% from 2023 to 2024, while indemnity claims decreased 0.7%.
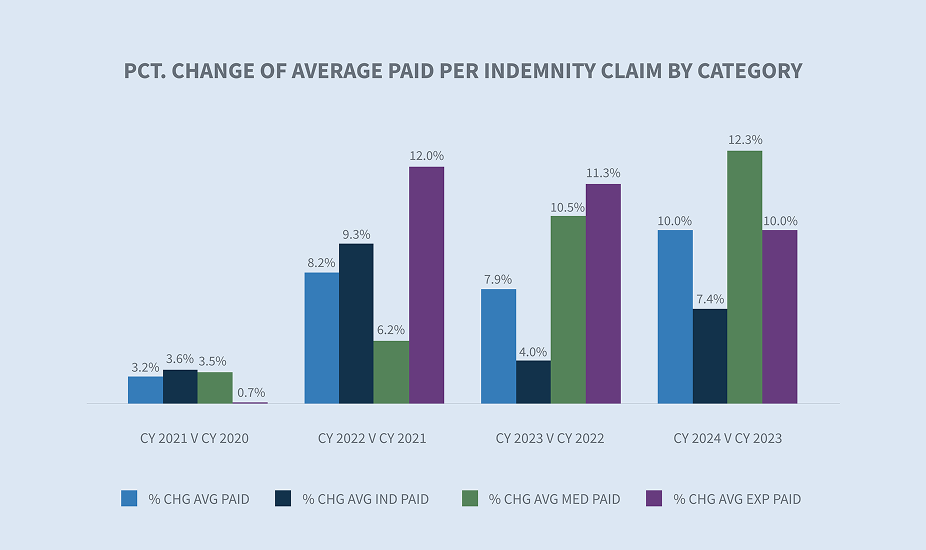
The average paid per indemnity claim went up by 10% in 2024, with increases in every paid category.
The average medical paid per indemnity claim increased 11.3% from 2023 to 2024.
The overall workers’ compensation closure rate increased 1% in 2024, and the indemnity closure rate had a slight increase of 0.8%.
The average duration days on closed indemnity claims decreased year-over-year.
The litigation rate for new indemnity claims increased from 12.7% to 13.4%. The average incurred per litigated indemnity claim increased 5.3%, and non-litigated indemnity claims increased 7.6%
Market
AM Best’s Market Segment Report: U.S. Workers’ Compensation Insurance Segment’s Winning Streak Continues notes that workers’ compensation has been more profitable than any other personal or commercial line of business since 2015. This underlies AM Best’s current stable outlook on this specific segment. Note the following trends:
| • | Effective workplace safety initiatives of the past decade or more have helped control loss frequency and, along with declines in fraud and defense costs, contributed to the line’s excellent underwriting margins. |
| • | Premium growth spurred by wage increases and job growth have brought net premium above pre-pandemic levels. |
The insurance third party administrators (TPA) sector is experiencing significant growth. According to Market.US, a significant market driver is the cost-effectiveness of outsourcing administrative tasks, which allows insurance companies and large self-insurers to focus on customer service and strategic initiatives. The adoption of technological advancements that enhance operational efficiency is expected to create future growth opportunities in this market.

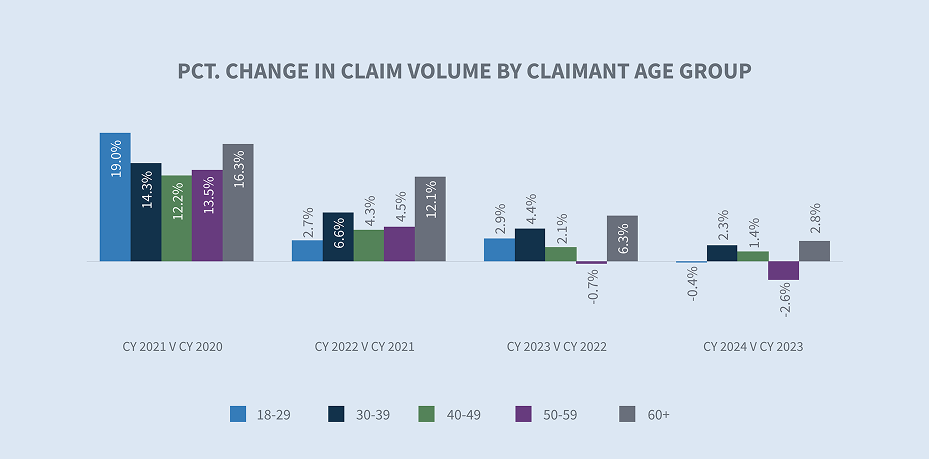
Claim volume
Compared with 2023, Sedgwick’s data for fiscal year 2024 reflects a 0.3% increase in total claim counts and a 0.7% decrease in indemnity claims. This indicates continued moderation of employment gains in the U.S. labor market and the absence of COVID claims.

The decrease in claim counts can be partially explained by slower job growth. According to the Bureau of Labor Statistics’ (BLS) TED: The Economics Daily Report, published Jan. 23, 2025, the economy added 2.2 million jobs in 2024, which was significantly less than the 3 million added in 2023.
Sedgwick’s claim volume change by age group had similar trends to the overall total. The 60+ age group had the largest year-over-year increase at 2.8% from 2023 to 2024.
From an industry-level perspective, NCCI highlighted in its Jan. 10, 2025, Labor Market Insights report that the strongest areas of growth were in healthcare, leisure and hospitality services. Sedgwick’s top claim count increases were seen in the healthcare, construction and paper products industries.

Sedgwick data shows the largest percentage change in claims volume occurring in Texas, New York, Pennsylvania and Virginia.

The share of indemnity claims continued a downward trend in CY 2024 (-0.7% from CY 2023).

Demographics are becoming more of a driving factor in workers’ compensation. According to BLS Employment Projections, for 2023 to 2033, a 22.4% change is expected for workers age 65–74 and a 79% change for workers 75+. Sedgwick’s breakdown of indemnity claims by claimant age group reveals the 60+ bracket has had the largest share of indemnity claims over the past five years.

Following is a comparison of Sedgwick percentage change in indemnity claims to industry reports.

* AAPC = Annual average percentage change.
* NCCI normalizes data with employee counts or payroll.
* WCIRB report normalizes the data with employee counts or payroll.
Claim costs
Indemnity
When compared to CY 2023, there was a 10% increase in the average paid per indemnity claim in CY 2024.
The state filter of the average weekly wage (AWW) inflation tool allows for comparisons of AWW by state. According to the Jan. 31, 2025, BLS Employment Cost Index, wages and salaries increased 5.5% for union workers and 3.5% for non-union workers in the 12-month period ending in December 2024. In 2025, 21 states increased minimum wages for more than 9.2 million workers according to the Economic Policy Institute minimum wage tracker.
It’s worth noting that most states annually index their maximum indemnity benefit to the state average weekly wage (SAWW) to prevent inflation from eroding the level of workers’ benefits. Accordingly, indemnity benefit costs will vary by jurisdiction.

Our inflation analysis of temporary total disability (TTD) paid per day indicated a 5.4% increase for CY 2024 compared to CY 2023. The public sector, transportation industry and healthcare industry experienced the largest increases at 13.4%, 6.4% and 5.8%, respectively.
The rate of indemnity claims with at least one day of TTD payments increased in CY 2024. There was a slight uptick in TTD rate for all age groups, although we saw a slight decrease in TTD days for the 18–29 age group.

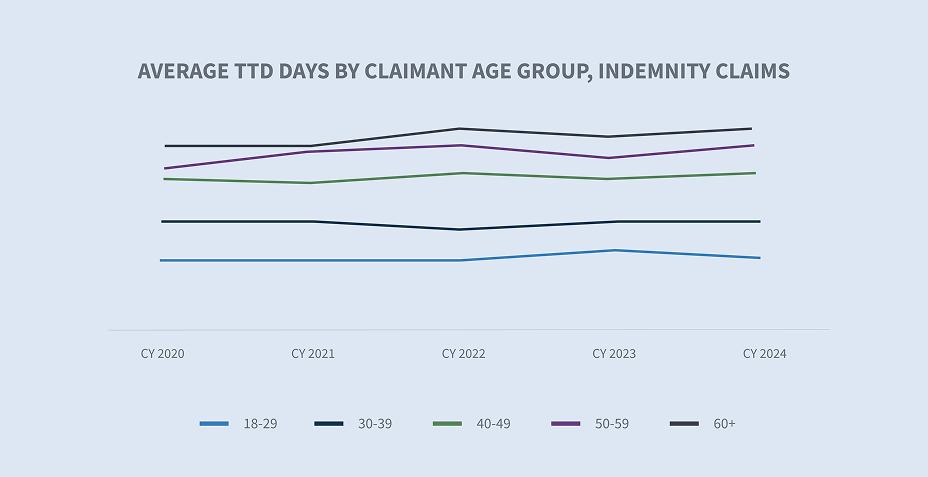
The average TTD days increasing with the claimant’s age can be attributed to delayed recovery and return to work, which means lengthier periods of lost wage payments. To decrease these potential costs, some employers are implementing wellness and incentive programs to encourage healthier lifestyles and focusing on return to work programs.
Medical costs
The average paid for medical services increased 11.3% from 2023 to 2024. Two factors drive changes in medical claims costs: the price of medical services and utilization, which measures the mix and number of services provided to an injured worker.
Price
Our medical inflation analysis indicated a 2.9% increase in the price per service change between CY 2023 and CY 2024 for professional medical services — evaluation and management, physical therapy, major and minor diagnostics and surgeries — for all states. Use of the tool also reflects a 4.3% greater price per service for states without a fee schedule for professional medical services (i.e., Indiana, Missouri, New Jersey and Wisconsin) and a 2.8% increase for fee schedule states.

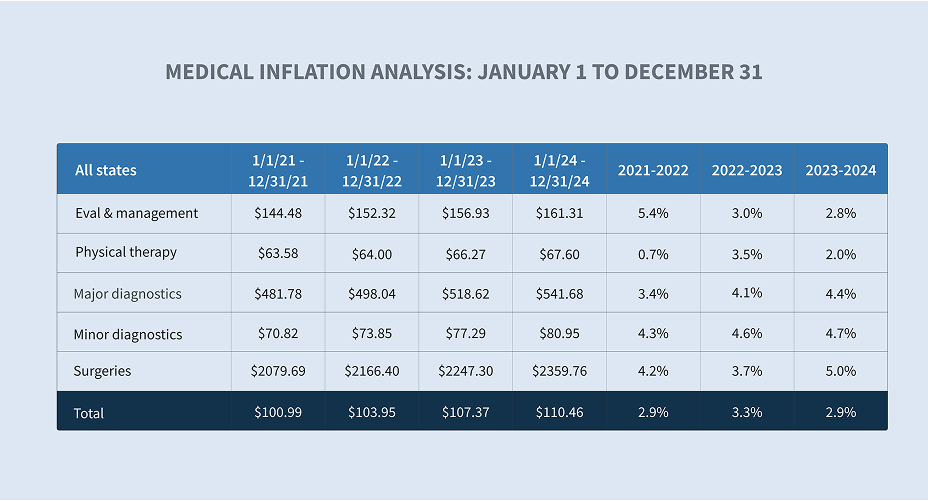
Drilling deeper reveals that the cost for surgeries in CY 2024 increased 5.1%, and 4.5% and 4.3%, respectively, for major and minor diagnostics from CY 2023.

In addition to professional medical services, spending on facilities — which includes hospital outpatient, ambulatory surgical center and hospital inpatient — continues to be a significant driver of workers’ compensation cost.
In CY 2024, there was a 3.6% increase in pharmacy paid year-over-year. These costs are driven by categories of drugs such as topicals, compound kits, specialty and physician-dispensed medications that can be associated with significant expense.
Engaging Sedgwick’s complex pharmacy utilization review team for support as appropriate ensures these challenges are addressed, while promoting clinically-appropriate medication and savings.
Impact of state fee schedules
Workers’ compensation medical costs are controlled by regulations and fee schedules in most states. This results in substantial differences in prices paid for medical services, including the approach and frequency of fee schedule updates. According to the WCRI Flash Report: Medical Payments in Workers’ Compensation During the Recent Inflationary Period, states that rely on inflation measures such as the Consumer Price Index (CPI-U) or statewide AWW to update their fee schedules experience faster price growth.

Medical providers are pushing for fee schedule revisions, with some success in states without scheduled revisions. In 2024, Florida Senate Bill 362 increased the maximum reimbursement allowances (MRA) for physicians from 110% to 175% and increased the MRA for surgical procedures from 140% to 210% of the reimbursement amount allowed by Medicare. This is sure to increase medical costs in the state.
Differences in medical severity by age group
Not surprisingly, the average medical services paid per indemnity is greater as employees age. For the 60+ age group, the average medical services paid was more than 26% greater than the overall average for all indemnity claims.

According to the CDC National Institute for Occupational Safety and Health (NIOSH), older workers are less likely to be injured, but their injuries are more likely to be serious or fatal — particularly after age 60. As people age, pre-existing conditions and comorbidities often complicate and prolong medical treatment, thus increasing costs.
Utilization
In addition to the cost factors outlined above, utilization is the other determinant of medical costs. Multiple states have adopted varying policies and guidelines to ensure timely and medically necessary care for injured workers.
Again, there are state differences that may affect utilization of services, including:

| • | Utilization review (UR) in the form of prior authorization or post-procedural review is mandatory in only 25 states, with different required standards, procedures and time frames for decisions |
| • | Adopted treatment guidelines used in approximately 23 states vary between national and state-specific guidelines | • | Regulatory structure for dispute resolution |
Sedgwick claim systems include automated triggers to prompt timely actions and collaboration by our claims and managed care colleagues.
NCCI’s workers’ compensation weighted medical price index (WCWMI) grew by 2.3% in 2024, compared to 2.9% in 2023.

* Medical paid includes all pay codes
* AAPC – Annual average percentage change
* WCIRB reports ultimate medical severity
Closures
The percentage of all claims closed in CY 2024 stayed consistent, with a 1% increase, and a 0.8% increase for indemnity claims.

The duration of indemnity benefits, another component of indemnity costs, decreased in CY 2024 when compared to CY 2023.

Expense costs
Allocated lost adjustment expense (ALAE) costs per indemnity claim are driven by three major categories:
| 1. | Average medical cost containment program costs |
| 2. | Legal fees |
| 3. | Medical-legal |

While average expenses paid increased in each of these categories, medical-legal and legal fees reflected the largest increases, at 10.1% and 8.7%, respectively.

Defense attorney fees make up 82% of legal fees, and the average paid increased approximately 4.3% in CY 2024. Legal fees increased 8.7% in CY 2024, driven by increases in attorney fees (non-litigated), court costs, court reporters, depositions, photocopies and non-medical witness fees.

In CY 2024, claim litigation rates for closed indemnity claims remained the same as in CY 2023 (4.6%). The average incurred for closed litigated new claims is 3.7x over non-litigated claims. The WCIRB California 2024 State of the System report points out that a sharp rise in average ALAE is driven by increased litigation across the state.
Since litigated claims historically cost more, increases in the litigated rate per claim result in increased indemnity and medical costs.

Future considerations
In early 2025, the U.S. workplace continues to evolve at an unprecedented pace that is profoundly impacting workers’ compensation.
Workforce demographic shifts
The U.S. workforce demographic shifts in age, generation and where we work will inevitably affect the outcomes and costs of workers’ compensation claims.

| • | According to a Pew Research study, roughly one-in-five Americans ages 65 and older (19%) were employed in 2023 — nearly double the share of those who were working 35 years ago. Women make up a larger share of the older workforce, today representing 46% of all workers 65 and older. Demographic shifts, such as a change in the age and gender distribution of workers, may also affect injury frequency and severity. |
| • | Over the past two years, several states have enacted legislation to loosen restrictions on which occupations allow minors ages 14 to 17 years old to work, as well as the number of hours they’re allowed to work. According to NIOSH, these young workers have high rates of job-related injury. |
| • | Today’s workforce is now primarily made up of four generations. Millennials comprise the largest share of the labor force. Generation X occupies the second-largest share of the labor force. Gen Z workers make up almost 20% of the labor force, surpassing Baby Boomers for the first time. |
| • | While working in office buildings, physical retail locations, warehouses and factories remains integral to many industries, approximately 35% of employed people worked at home in 2023, according to the BLS American Time Use Survey. |
As these labor trends evolve, attention to safety, training and return to work programs becomes critical.
Medical accessibility/costs
Medical costs and severity are expected to increase in the future:
| • | According to one study, The Complexities of Physician Supply and Demand: Projections from 2021 to 2036, published March 21, 2024, by the Association of American Medical Colleges (AAMC), the U.S. will face a shortage of up to 86,000 physicians by 2036. The shortage is widespread across all specialties, including primary and non-primary care, according to the National Center for Health Workforce Analysis, which released its physician workforce projections in November 2024. The report forecasts that 31 out of 35 physician specialties will see shortages by the year 2037.This demand for healthcare will inevitably impact accessibility. Sedgwick data is already showing slight increases in the lag between the date of loss to the first service date(s) of certain medical treatments, with variation in results by state. |
| • | Consolidation remains a trend in the healthcare market, with hospitals and other healthcare entities merging or being acquired. While state-level scrutiny may continue, recent election results will likely halt the inquiry launched last year by the Federal Trade Commission (FTC), the Department of Justice (DOJ) Antitrust Division and the Department of Health and Human Services regarding the impact of healthcare consolidation on markets. |
| • | Medical advances, such as robot-assisted joint replacement surgeries, are less invasive and decrease infection risks, but carry approximately 25% greater costs than traditional approaches. |
Workers’ compensation is not immune to these trends. Recognizing the medical exposures and developing strategies to manage and mitigate associated costs are as important as ever.
Technology transformation
Technology is playing an increasingly significant role in reshaping the workers’ compensation industry. Artificial intelligence and automation are no longer futuristic concepts but present-day realities. Areas where strategic adoption will potentially transform workers’ compensation processes include:
| 1. | Artificial intelligence: Use of AI is anticipated to improve claims processing efficiency and aid in identification of workers’ compensation fraud, leading to reduced claim costs and overall risks. |
| 2. | Telemedicine: This technology allows injured workers to receive medical consultations remotely, thereby improving access and convenience. |
| 3. | Wearable technology: As the use of wearable technology advances, the data and information provided could lead to safer workplaces, facilitate return to work, and reduce the overall cost of workers’ compensation claims. |

This transformation brings both new challenges and exciting opportunities.
Mental health claims legislation
According to a recent report published by the Centers for Disease Control and Prevention (CDC), about one of every five adults has experienced symptoms of anxiety (18.2%) or depression (21.4%) in the past two weeks. A new fact sheet published by OSHA states, “Mental health concerns due to work have the potential to adversely impact an employee’s social interactions, productivity, performance and absenteeism.”
The prevalence of mental health challenges is driving legislative changes. Over the past decade, multiple states have enacted presumption laws to cover post-traumatic stress disorders (PTSD) for first responders. Connecticut and New York have recently expanded their workers’ compensation laws to cover PTSD for their entire workforce. It will take several years to understand the full impact of these changes on workers’ compensation costs.
Immigration reform
According to the Pew Research Center, in 2022, the number of unauthorized immigrants employed in the U.S. was 8.3 million, representing about 4.8% of the nation’s total workforce. It’s generally accepted that immigration is a matter of exclusive federal jurisdiction, and under the Immigration Reform and Control Act of 1986 (IRCA), an unauthorized immigrant cannot be employed in the United States. Based upon IRCA, the U.S. Supreme Court, in the 2002 case Hoffman Plastic Compounds, Inc. v. National Labor Relations Board, overturned the NLRB’s award of backpay to an unauthorized immigrant who had been laid off due to his participation in protected union-organizing activity.

Whether an unauthorized immigrant injured on the job is entitled to workers’ compensation benefits is a question of state law. The Hoffman decision led to challenges in multiple state courts, based on the argument that IRCA preempts state workers’ compensation laws. State laws and court decisions have varied.
There’s some speculation that the announced mass deportation and detention efforts of the new administration could result in fewer reported work injuries due to fear of deportation or employer retaliation. Moreover, language barriers and lack of access to information about available rights may further complicate the process.
Independent contractors
The classification of workers as independent contractors versus traditional employees remains a critical issue in workers’ compensation. In 2024, the Department of Labor (DOL) issued a final rule, Defining and Delimiting the Exemptions for Executive, Administrative, Professional, Outside Sales and Computer Employees, which was intended to tighten the criteria for classifying workers as independent contractors under the Fair Labor Standards Act (FLSA). Subsequently, five lawsuits challenging the rule were filed.
The U.S. Department of Justice secured a postponement of oral arguments, scheduled for Feb. 5, 2025, before the U.S. Court of Appeals for the Fifth Circuit in Frisard’s Transp., LLC v. United States DOL, No. 24-30223, to allow the incoming DOL leadership a chance to review the case.
The new administration will likely seek a stay of any further litigation in anticipation of further rulemaking to rescind the 2024 rule. The DOL may then undertake new rulemaking to restore the 2021 rule or simply allow the courts to address the issue without agency regulations.
Several states have taken steps to address workers’ compensation for independent contractors and gig workers. In 2024, the state of Washington passed House Bill 2382, extending survivor death benefits to dependents of transportation network company drivers under the industrial insurance act when certain conditions are met. California mandates that rideshare companies provide specific benefits to gig workers through its Proposition 22.

Expanding workers’ compensation to cover independent contractors could strain the financial stability of the system, requiring premium adjustments to account for the broader risk pool.
Heightened regulatory environment
In 2024, state legislatures convened in all but four states — Montana, Nevada, North Dakota and Texas. This year, legislatures will convene in all states.
| • | Multiple states expanded presumptions for first responders to either add more conditions or expand eligibility for first responders. Historically, these laws are applied to local public entities or certain state and federal agencies, although they sometimes apply to certain private sector employees or volunteers. The trend appears to be continuing this year. |
| • | Penalty exposure substantially increased in Nevada and Washington due to legislation enacted in 2024. Several states passed bills that increased claimant attorney fees and expanded circumstances when employers may be responsible for payment of those fees. Regulators in Minnesota, Oregon and Texas have taken steps to ensure the responsiveness of claims examiners. |
| • | Leadership within state workers’ compensation agencies has recently changed in several jurisdictions, with more changes anticipated due to retirements and recent election results. |
Sedgwick is closely monitoring these and other trends that may impact the workers’ compensation industry.