
- Summer 2024: CASUALTY
General liability
Report objectives
This report aims to summarize the present metrics for our general liability (GL) programs, assess the landscape of GL claims and litigation, and benchmark our patterns against comparable industry research.
data parameters
Our practice team uses JURIS claims data to perform comparative analyses informed by their expertise and analytics. The data in this report is based on both insured and self-insured claims for all states across five, 12-month periods (referred to as FY) from July 1, 2020, through June 30, 2024.
Key observations
2024 GL new claim volume increased 1.9% from FY 2023.
The total incurred on new claims increased by 3.7%, moderated from the same period last year, which was up 20.2%. GL claims with $0 incurred increased by 1% to 50.7%.
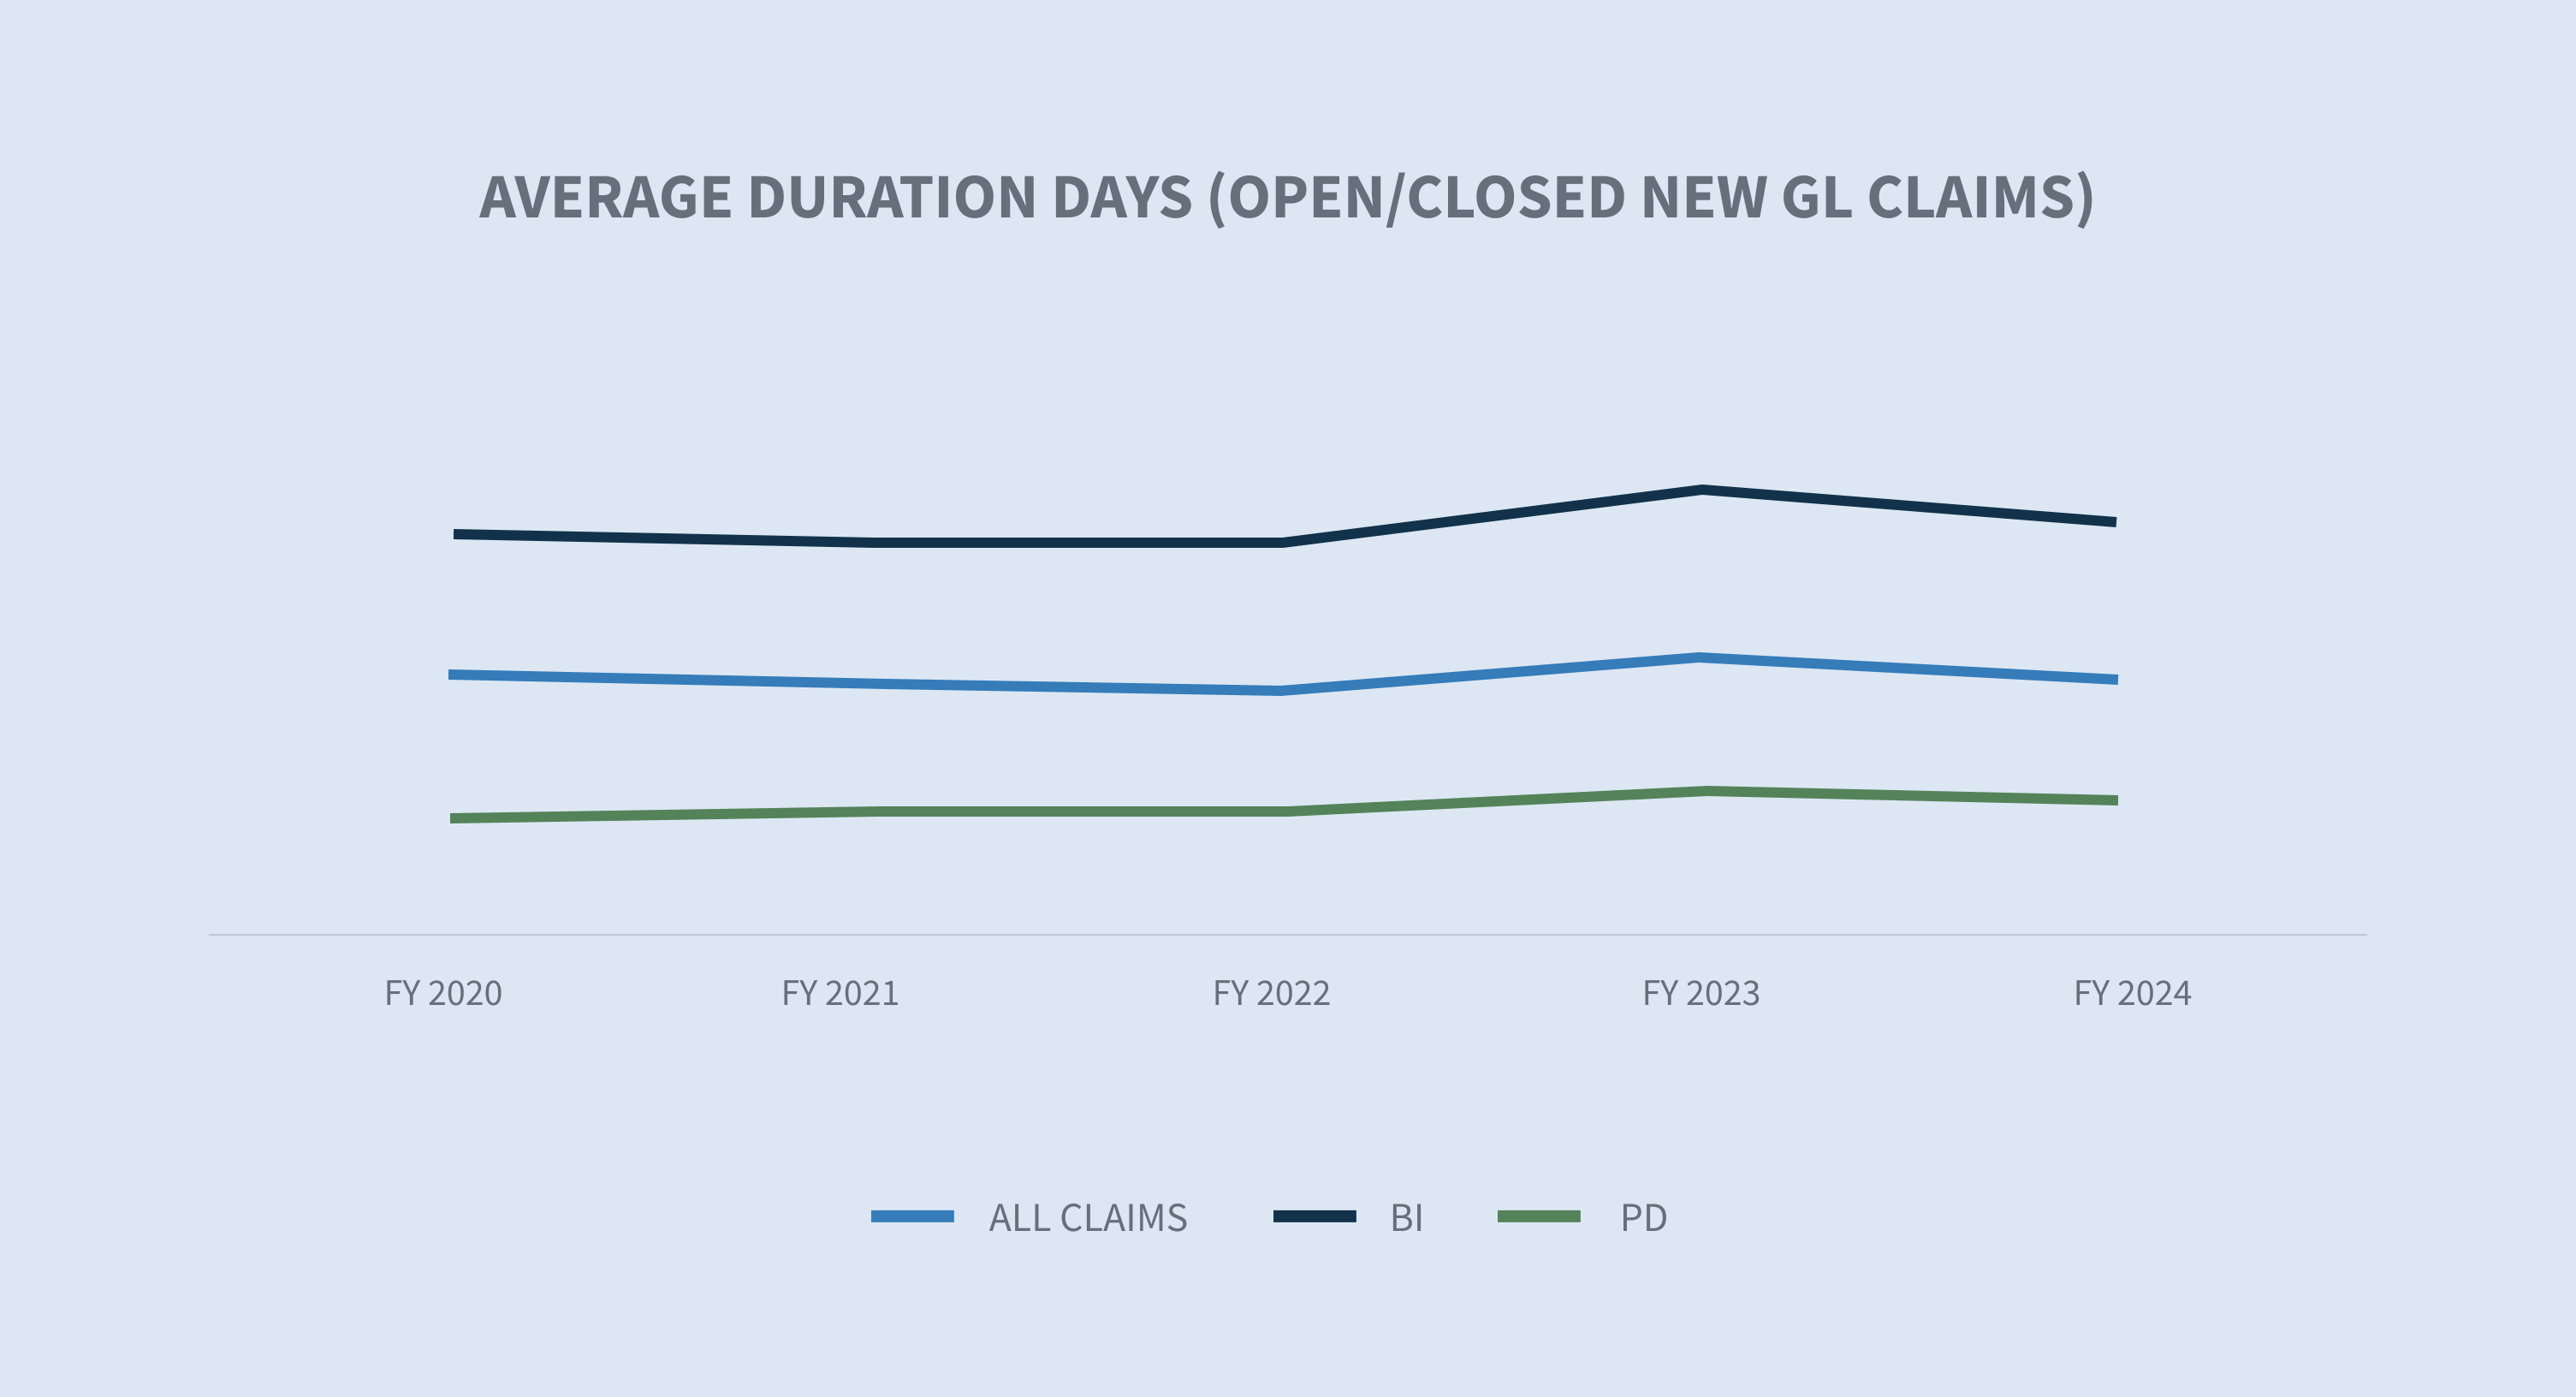
The average claims duration decreased by two days. Bodily injury (BI) durations decreased by three days, and property damage (PD) durations decreased by one day.
The denial rate on new claims increased by 2.5%. The average incurred for denied claims decreased 29.7% since FY 2023. The average incurred for accepted claims increased 10% since FY 2023.
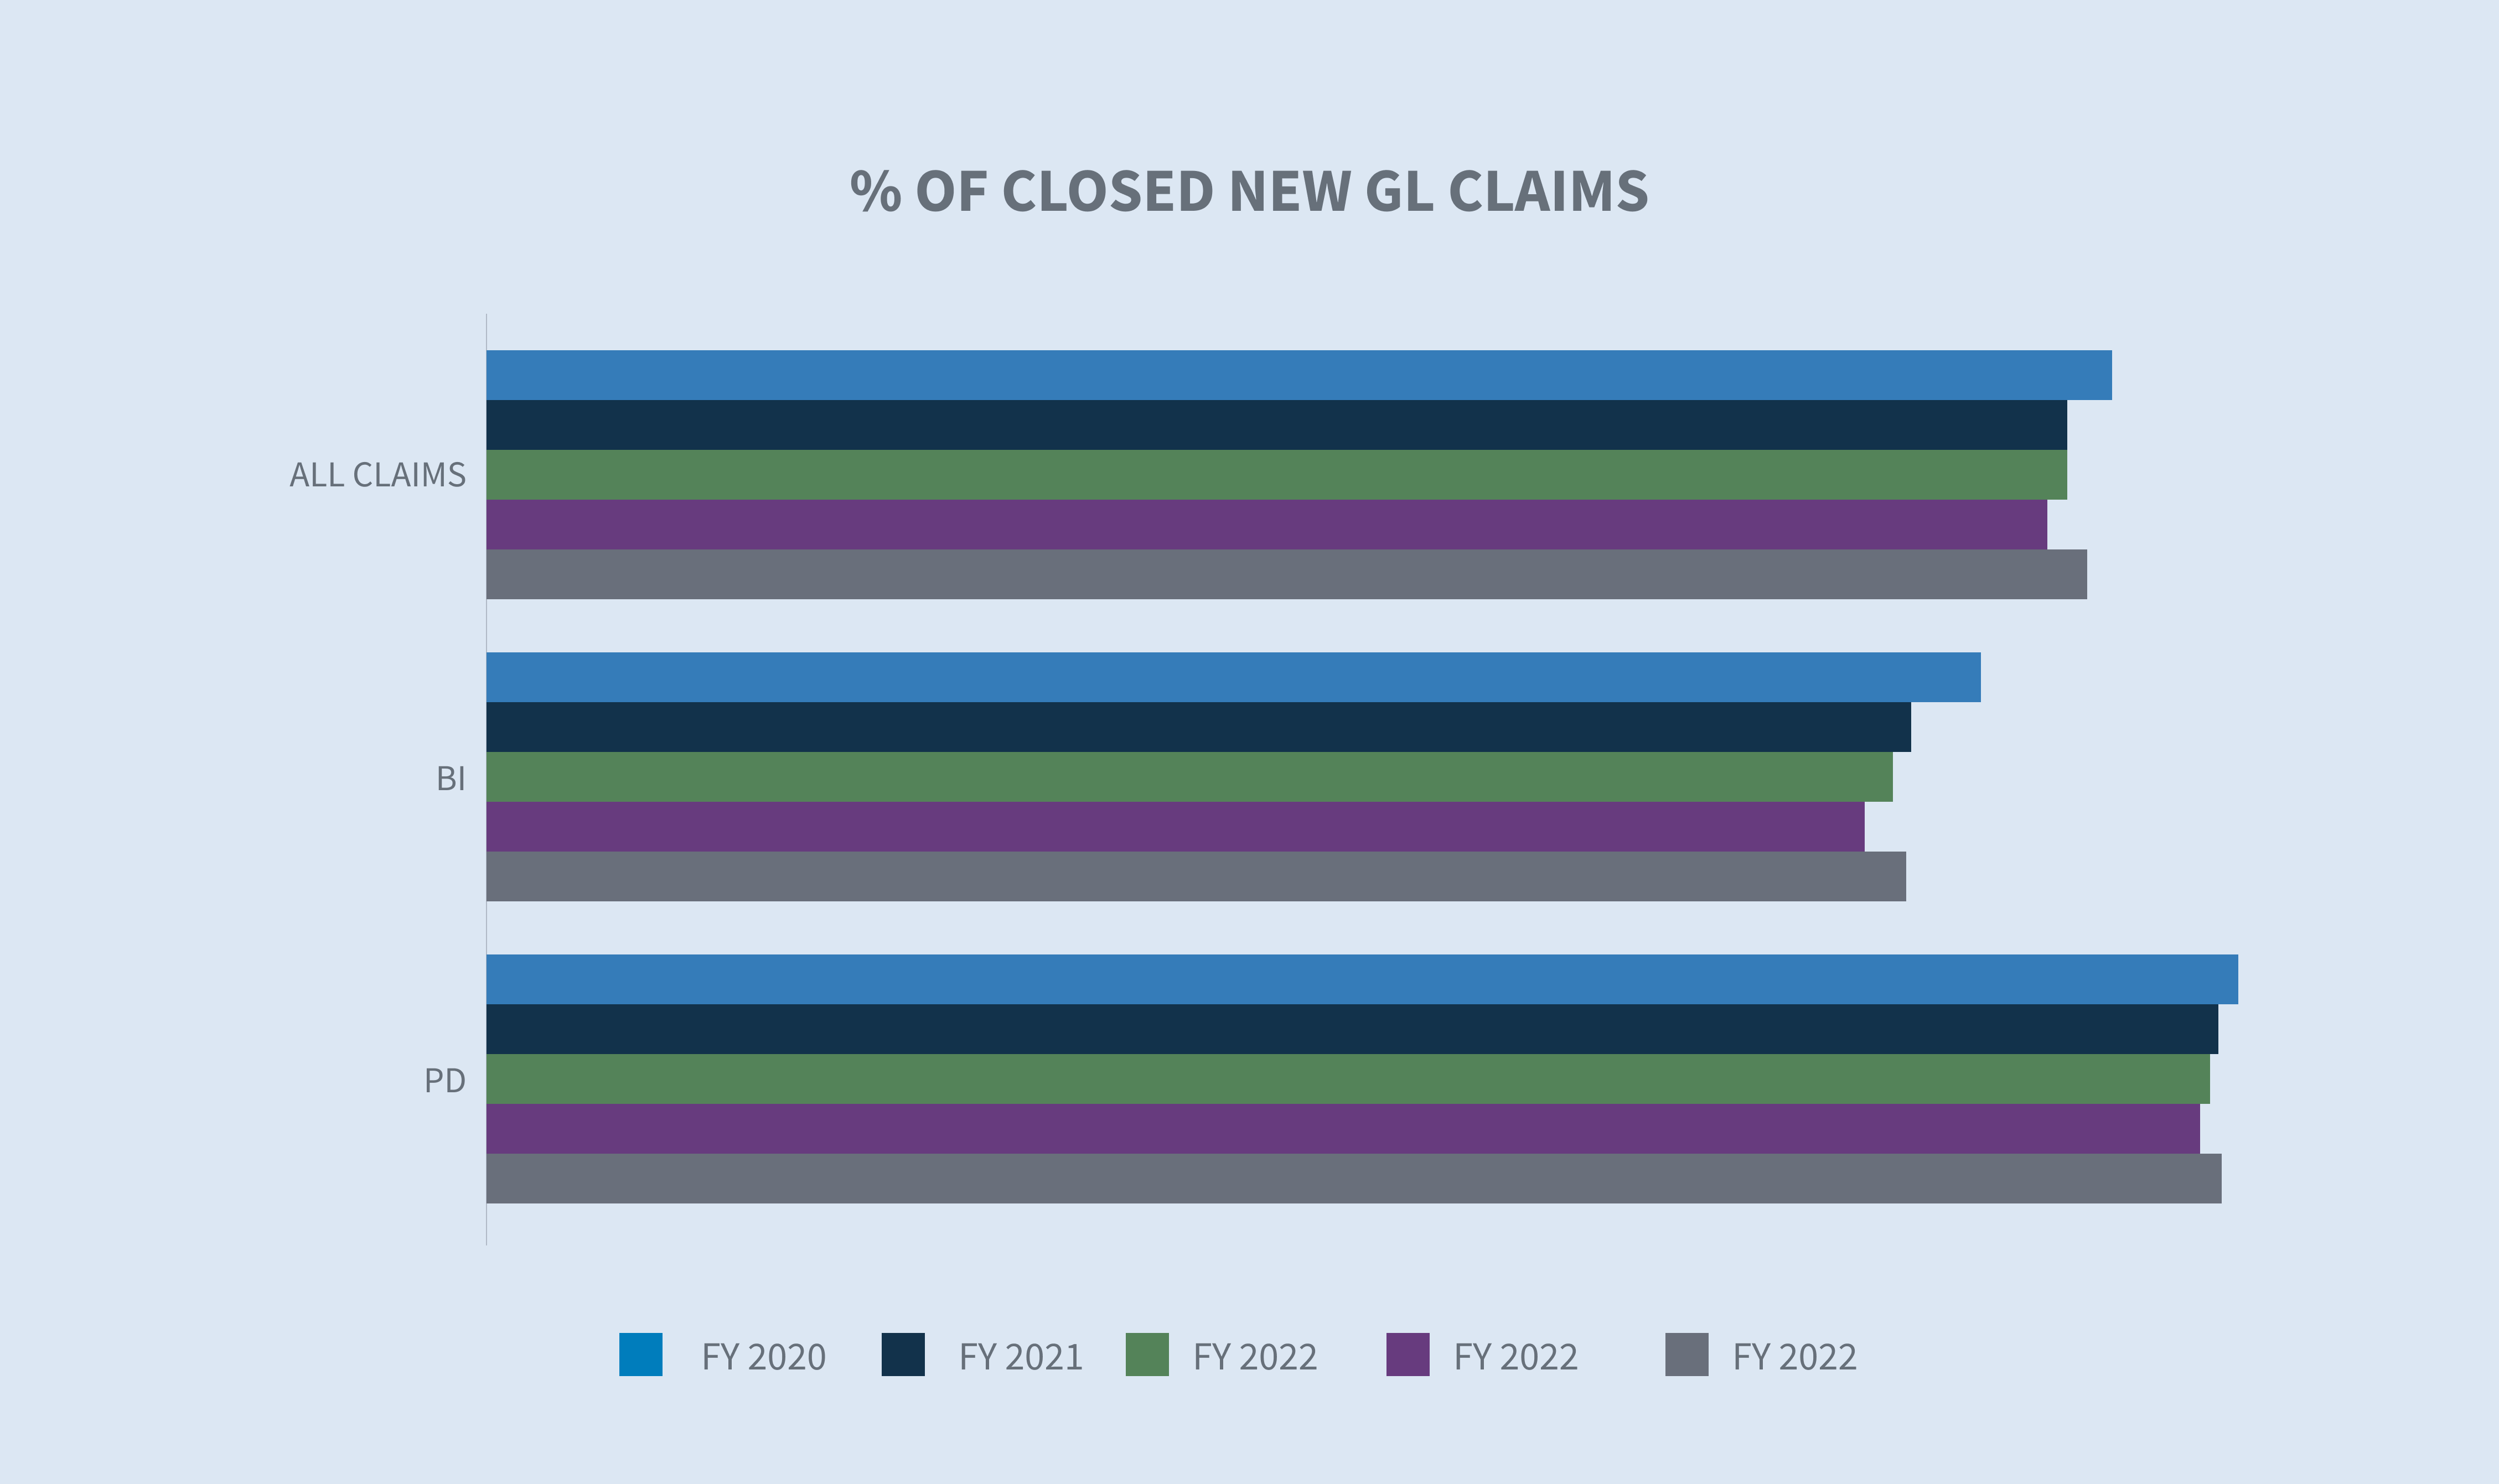
The closure rate for all new GL claims increased 1.9% in comparison to FY 2023. The BI closure rate increased 2.3%.
In FY 2024, total claims closed increased by 6.4% since FY 2023 and 16% over the last three years; 5.1% of the claims closed were litigated. The overall closure volume for litigated claims increased 11.28% over FY 2023.
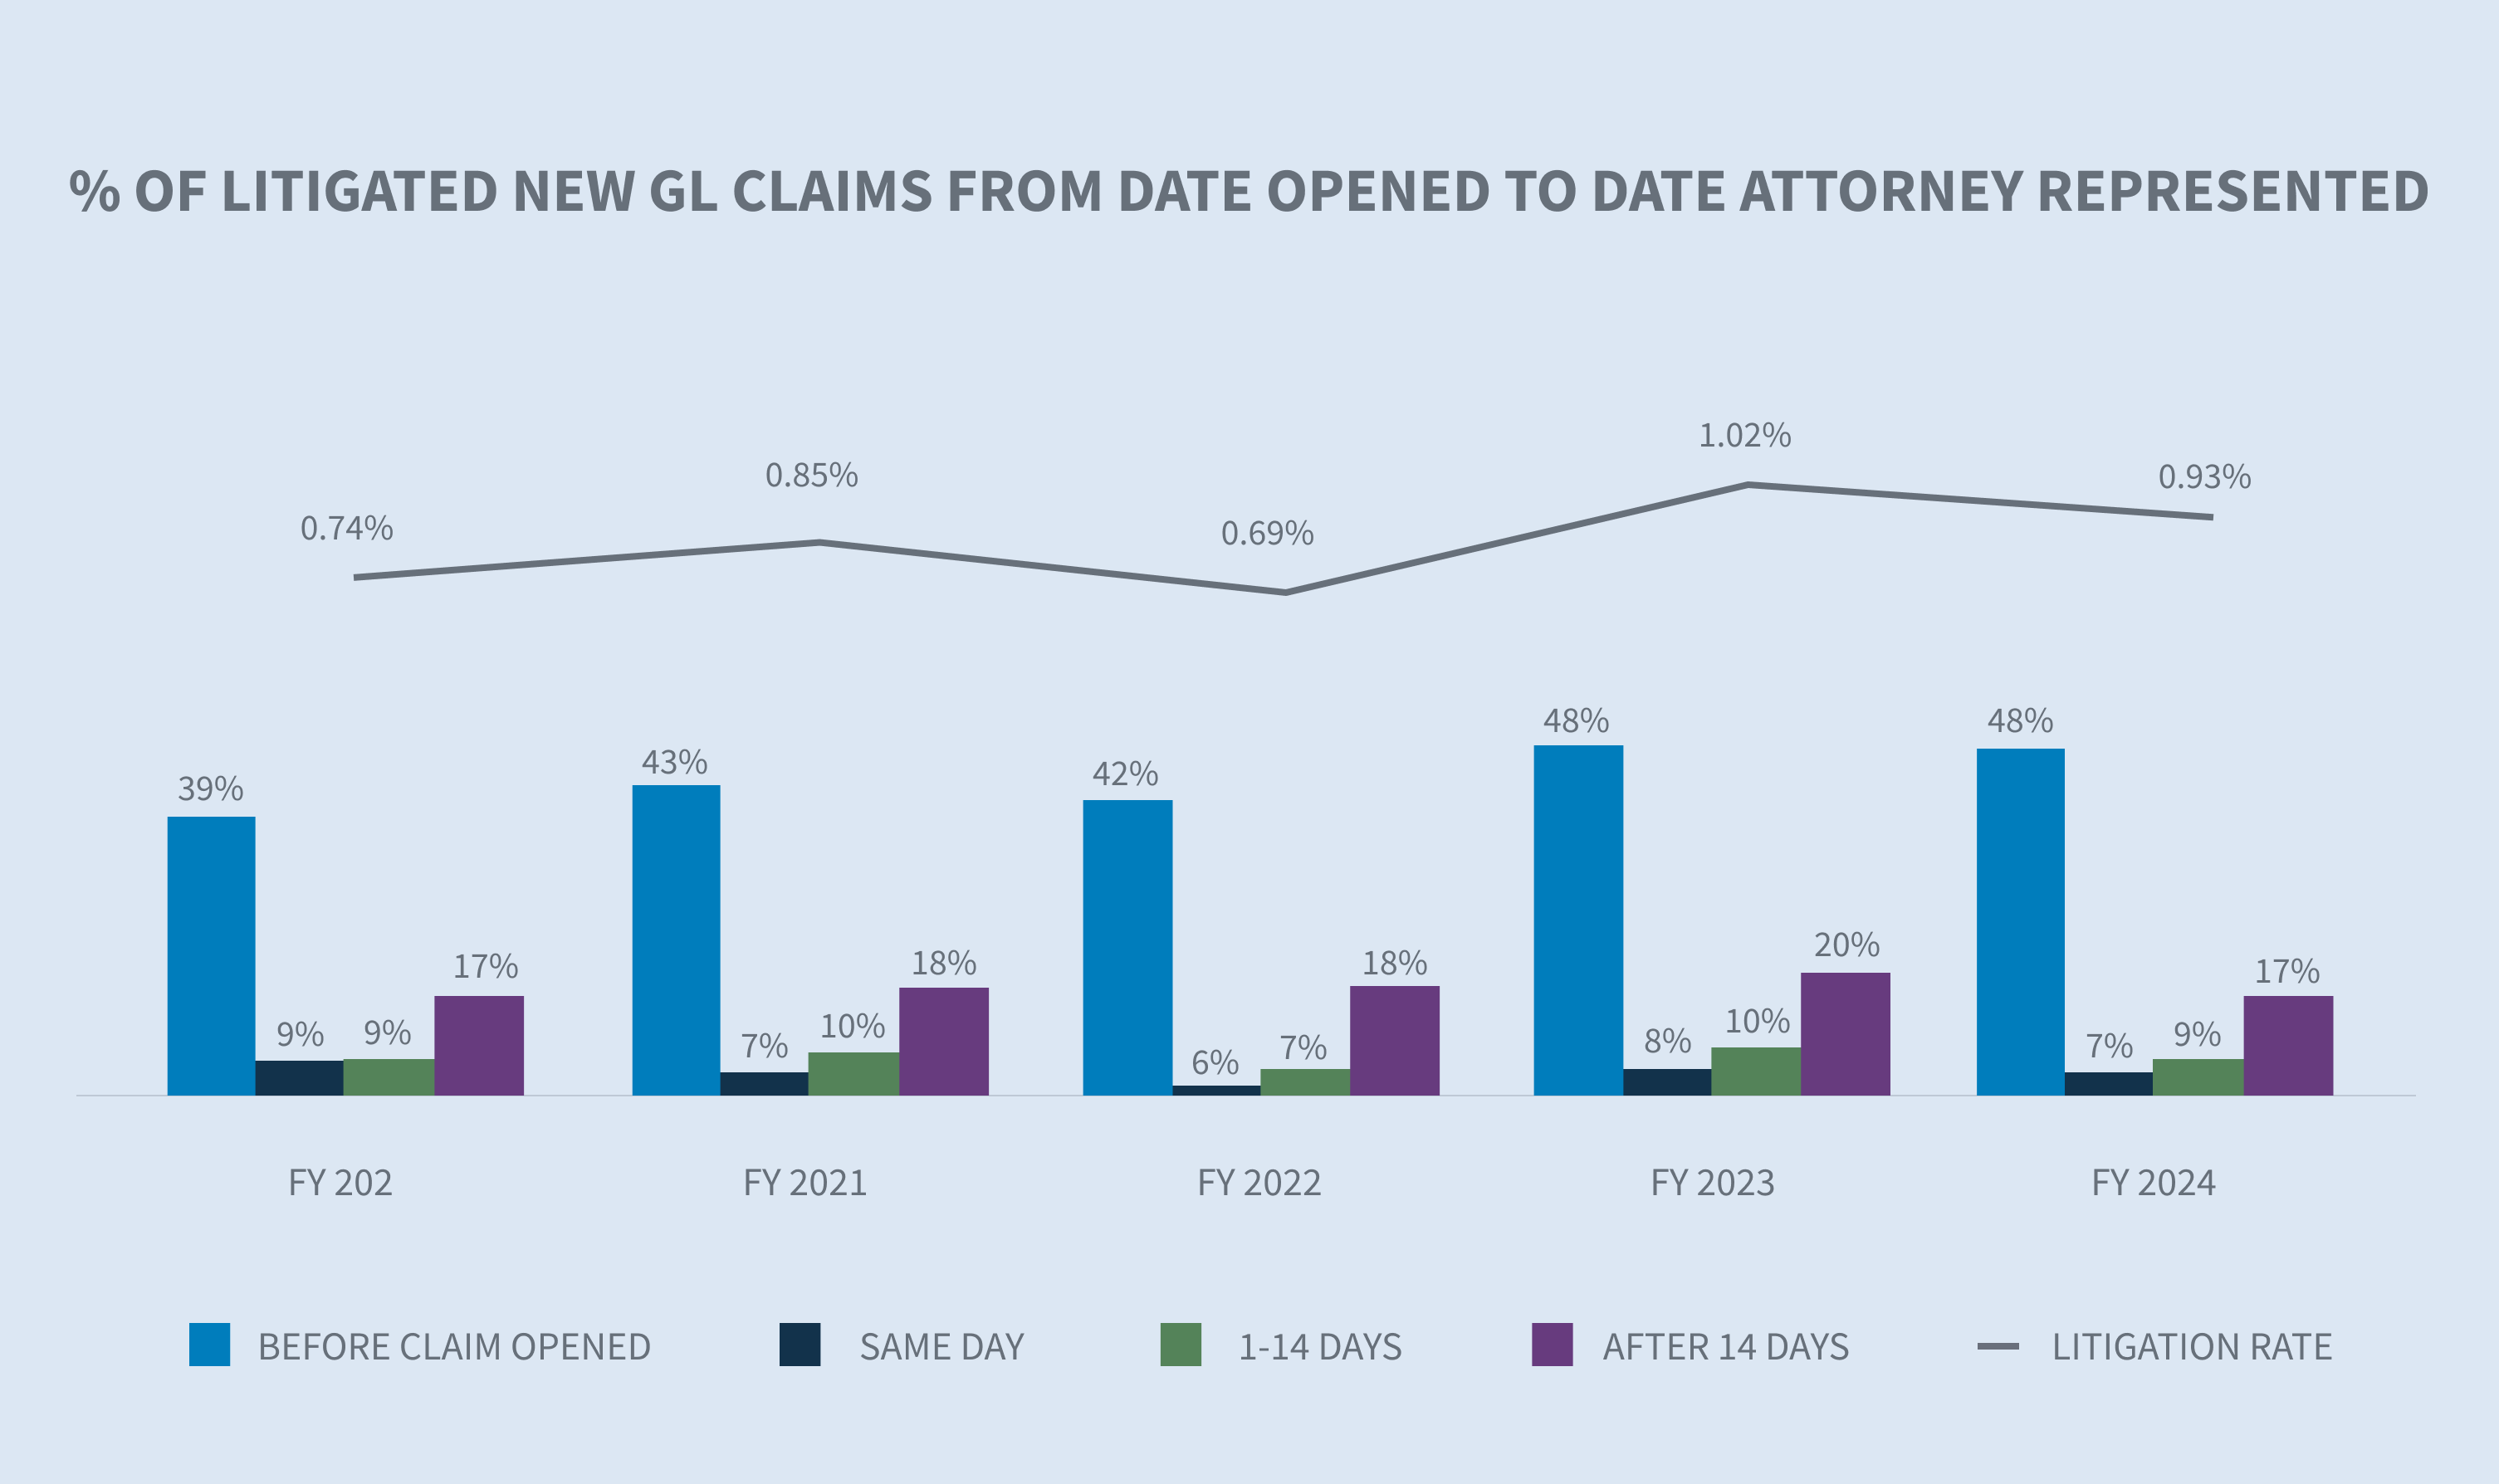
The new GL claim litigation rate decreased to 0.93% in FY 2024.
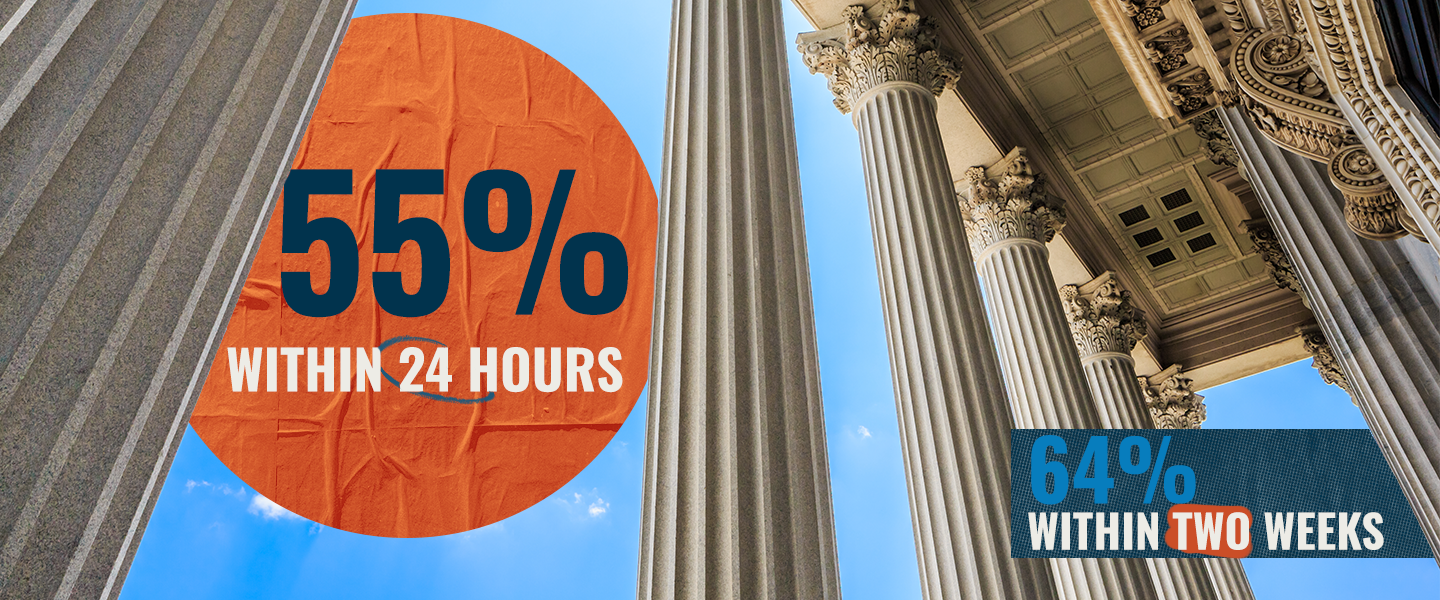
Currently, 55.3% of all GL cases that become litigated have representation in place within 24 hours of notice, and 64.3% will have representation in place within the first two weeks.
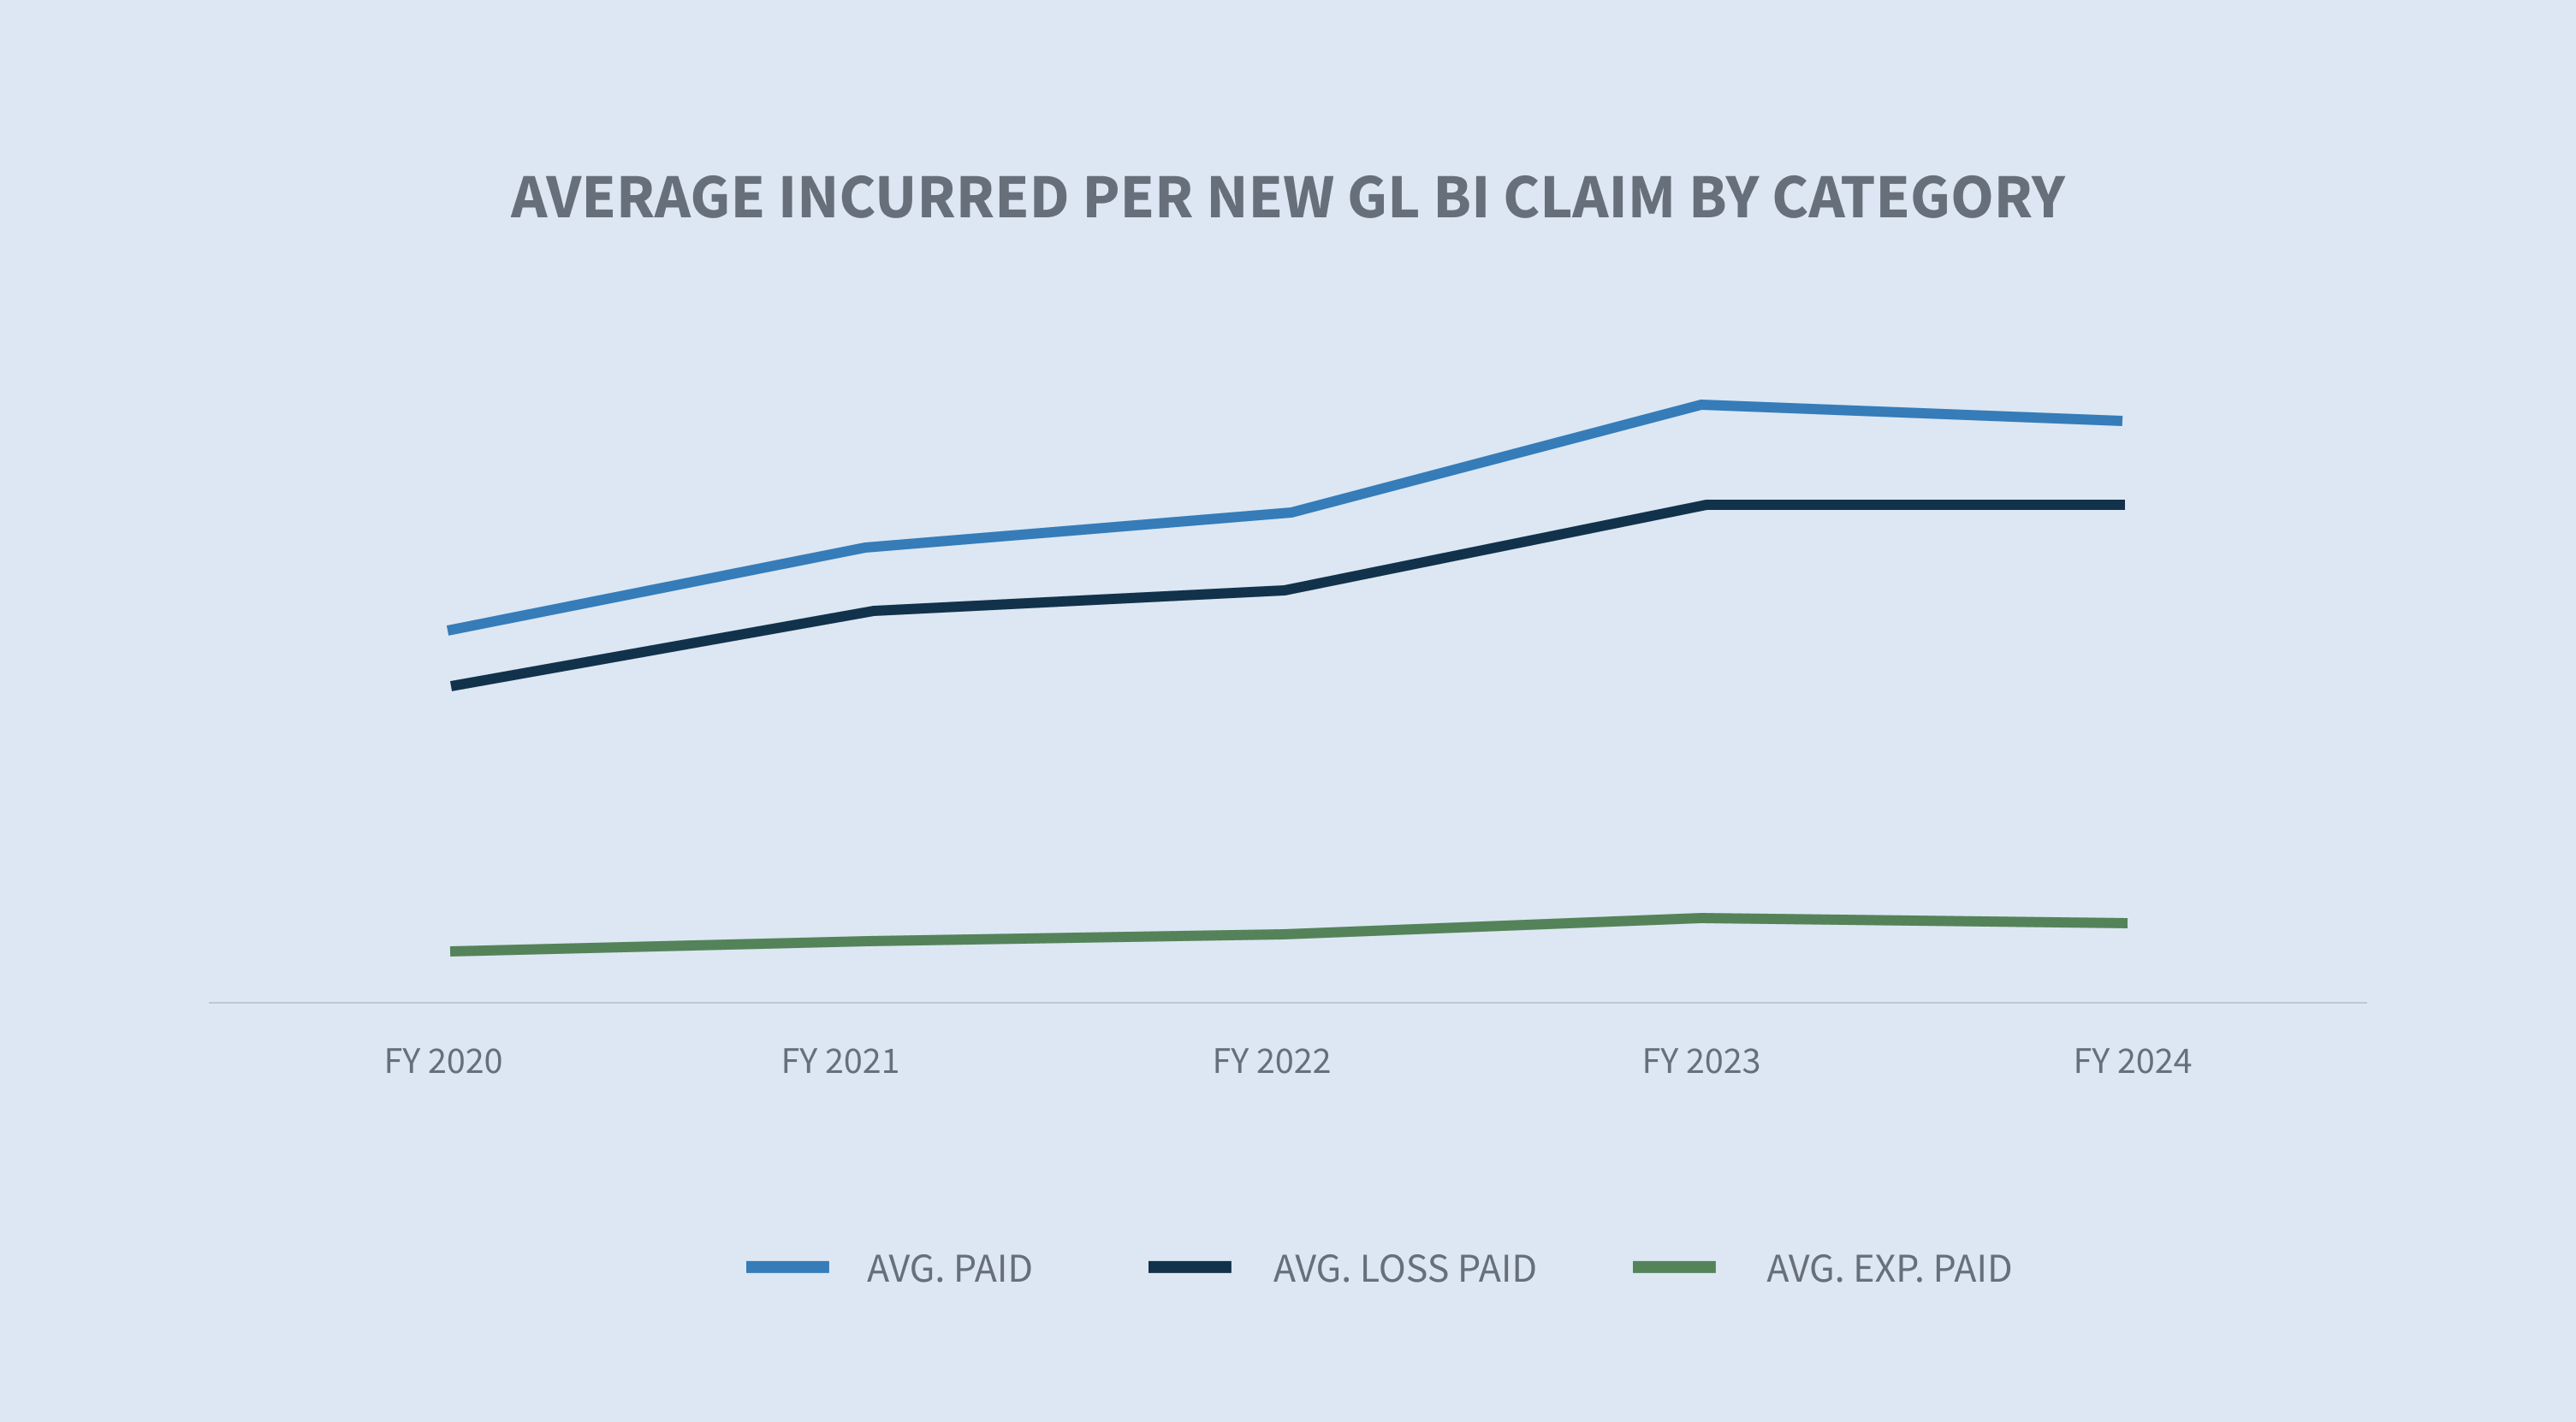
GL average paid increased 8.6% in FY 2024 after increasing 17.7% between FY 2022 and FY 2023. The two-year average paid increases are now at 27.8%. GL average paid increases are driven by GL BI average paid, which increased by 16.4% in FY 2024 and 42.1% over the last two years.
The average paid on GL closed litigated claims increased 6.5% in FY 2024. While closed litigated claims represented only 5.5% of all closed claims, they accounted for 65% of total paid costs.
GL closed claims with incurred above $100,000 represent only 2% of all closed claims in FY 2024 but account for 76% of all closed claim incurred. The average GL closed claim incurred in the $100,000+ stratification increased 2% in FY 2024.
Aged pending (two years or more) decreased 1.69%. Carrier claims were the driver with a 8.76% decrease in FY 2024.
Aged litigated pending decreased 2.8%.
Market
In its “2024 Property & Casualty Market Outlook,” CBIZ says that experts predict up to a 10% increase in GL premiums in 2024.
Statista notes that the U.S. GL market is experiencing a surge in demand due to increasing litigation risks and the need for comprehensive coverage.
GL insurance faces a challenging market with 25 consecutive quarters of rate increases driven by increased claims severity, higher litigation costs and economic inflation, according to Brown & Brown.
The recent Chevron doctrine decision (Loper Bright Enterprises v. Raimondo, Department of Commerce, et al.) creates uncertainty that will likely result in more litigation.
Volume
GL claim volume increased 1.9% overall in FY 2024. GL BI claim volume increased by 1.3%; PD claim volume increased by 4.6%; and other claim volume decreased by 13%.


Retail represented 64% of the overall GL claim volume and declined 3.3% in FY 2024. Overall GL claim volume increased by 1.9%, with a 25.8% increase in technology and communication and a 29.8% increase in energy.

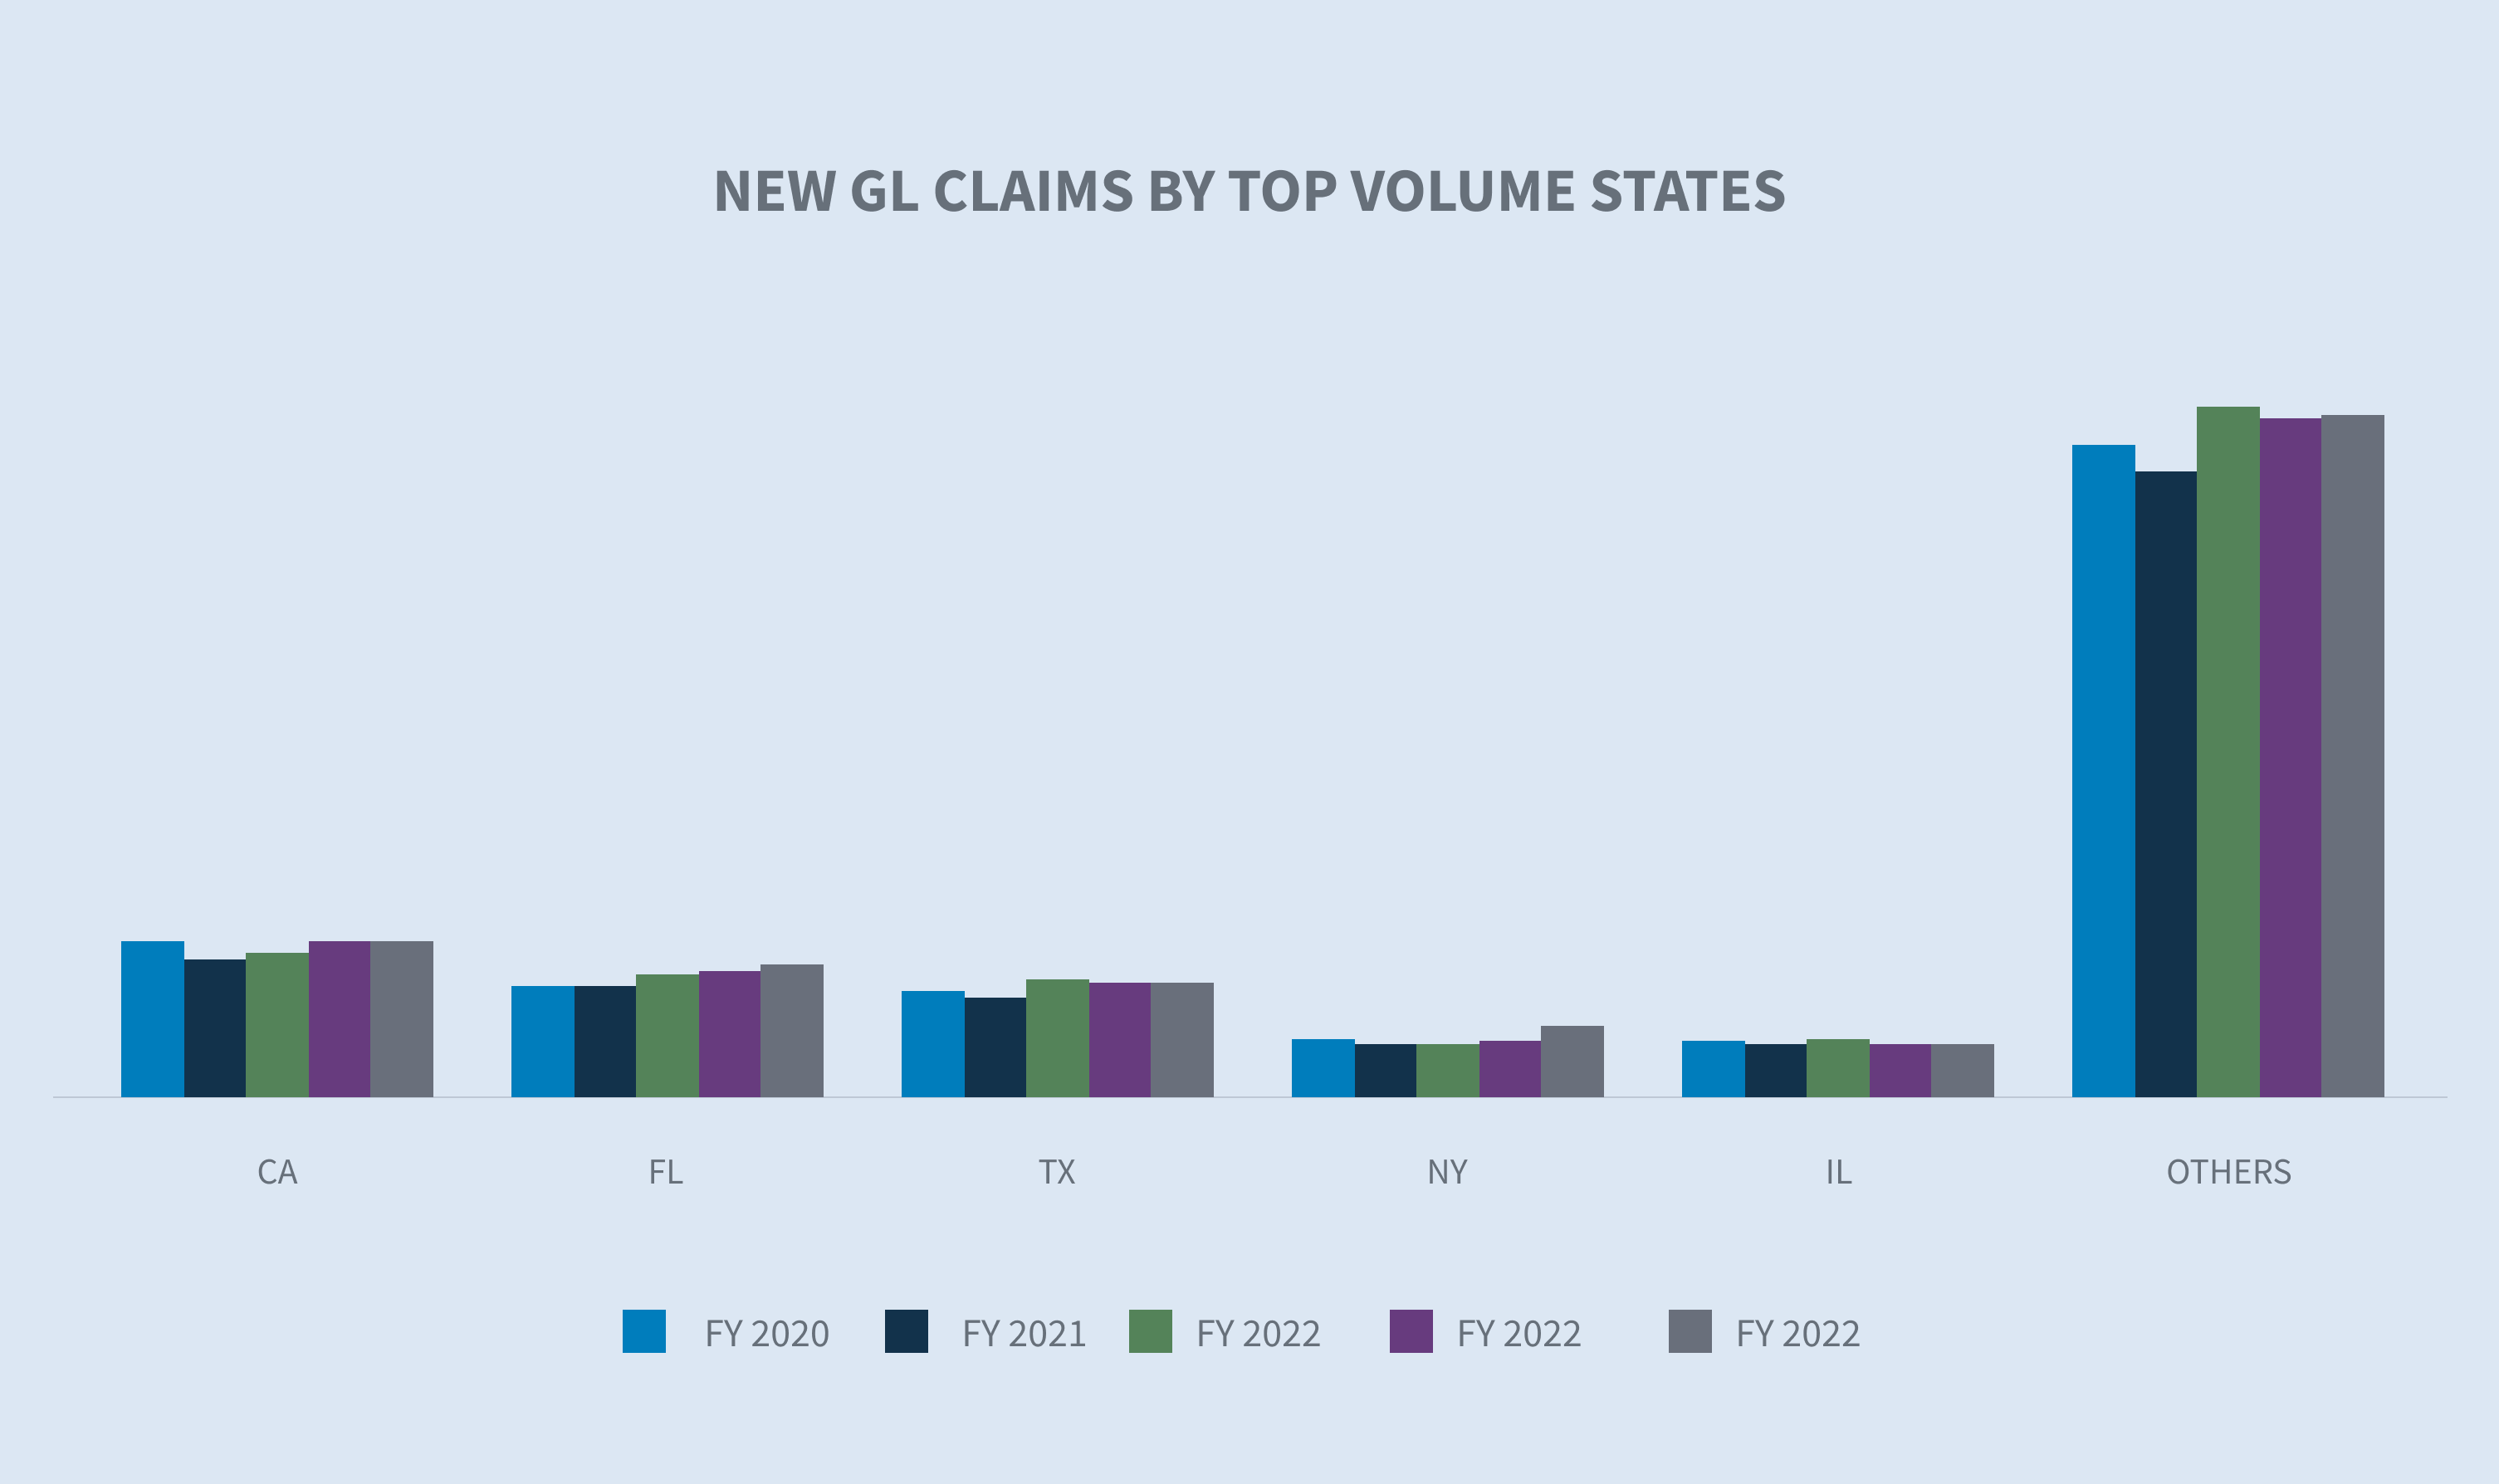
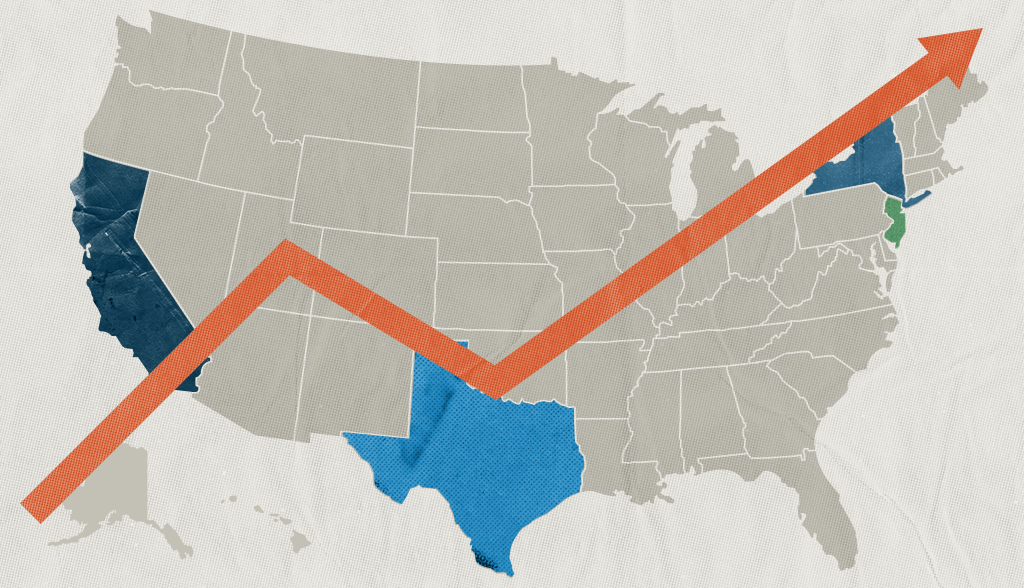
The five states generating the highest numbers of new GL claims are California, Florida, Texas, North Carolina and New York. Combined, they account for 43.3% of the GL new claim volume.
From FY 2023 to FY 2024, most of the larger states were flat or under a 1% difference in claim volume. The two largest states experiencing growth in their new GL claims were Florida (+6%) and North Carolina (+25.9%).

Denial rates continued to rise in FY 2024, increasing 2.5% to 24.5%. The average incurred on new denied claims decreased by 22.9%. The average incurred on new non-denied (accepted) claims increased 5.5% in FY 2024 compared to FY 2023 but has grown 21.3% since FY 2022.

Costs
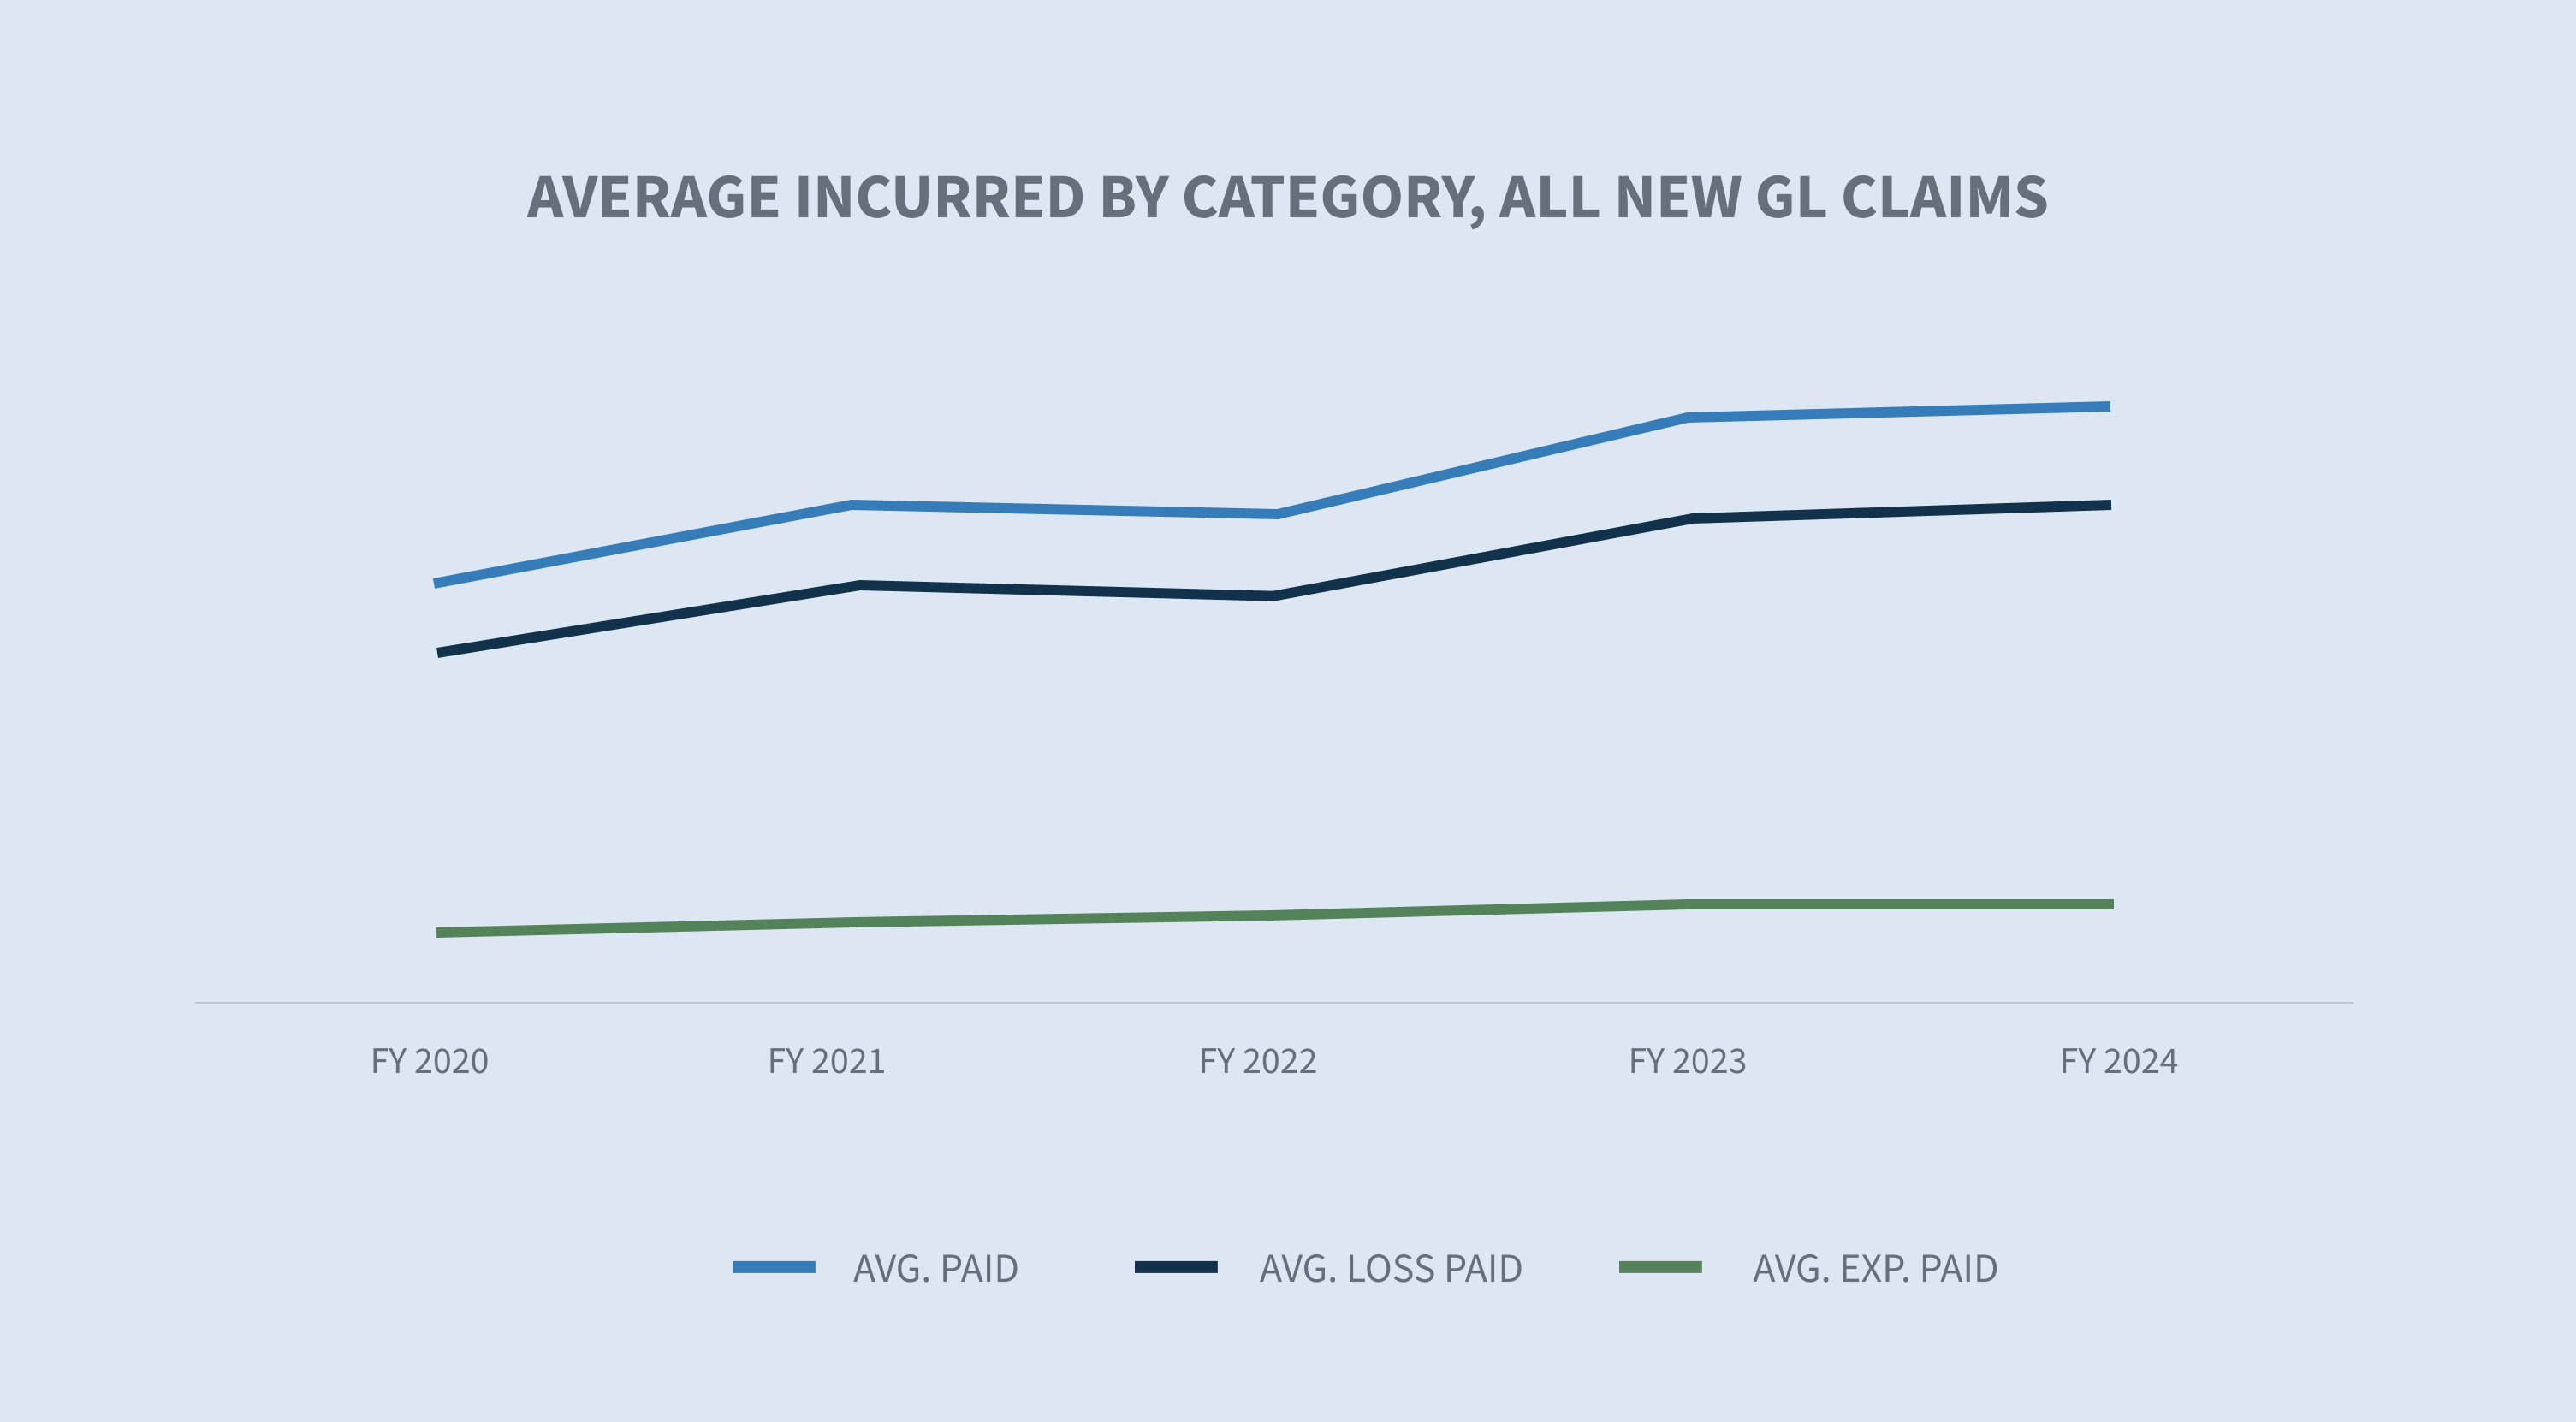
Average paid for new claims has continued to increase overall across all new GL claims, rising 36.1% since FY 2020. The average paid across all new claims increased by 8.6% in FY 2024, and the average cost per new BI claim has increased 32.3% since FY 2022 and 16.4% over the last 12 months compared to FY 2023.

Florida and Texas are the top states for average BI costs compared to FY 2023. All top five states, except for Florida (-6%), experienced double-digit percentage growth in the average dollar amount paid out on new BI claims — California (+10%), Texas (+26%), New York (+28%), Illinois (+27%), all other states (+23%).


The average incurred loss for all new GL claims increased 1.8% compared to FY 2023. The average incurred for new GL BI claims decreased 2.2% compared to FY 2023, driven by an 8.8% decrease in average expense incurred.
After a one-year decline from past year trends in the higher cost categories, claims within the $100,000+ category increased to 22% of the total incurred (0.2% of the new claim volume) and the $25,000 to $100,000 category increased to 33% of the total incurred (1.9% of the new claim volume).
Litigation
The litigation rate decreased to 0.93% for FY 2024. The decrease was driven by the wave of lawsuits filed in Florida before the March 2023 effective date of their tort reform. Fifty-five percent of all claims that will at some point involve litigation have attorney representation already in place within the first 24 hours of investigation.


FY 2024 average incurred on new BI litigated claims increased 8% over FY 2023. The overall cost of claims continues to increase, with litigated claims incurred values over 14.5 times that of non-litigated claims.

Litigation aged pending has been relatively flat for the last three years. FY 2024 saw an increase of only 0.23% over FY 2023. Overall aged pending decreased 2.8% in FY 2024 to 22.2% — its lowest in the last five years.

Closures
Liability closure rates for new claims for FY 2024 increased by 1.9% over the same period last year, driven by BI closure rates, which increased by 2.3%.
The average duration of all GL claims decreased by two days, with BI decreasing by two days and PD decreasing by one day.
Litigated claims currently represent 5.51% of the total closed claim volume yet account for 65% of the total dollars paid on closed claims. The average paid for a litigated claim increased 6.5% in FY 2024. The average paid on non-litigated closed claims increased 9.5%.

The higher-tier incurred groups have been relatively flat in terms of the volume of claims with 2% of the overall GL closed claim volume coming from the $100,000+ tier. However, when comparing the overall GL closed claim incurred stratifications, that same tier accounts for 76% of the total incurred for all GL closed claims with an average paid increase of 2% in FY 2024.
Future considerations
SEDGWICK TRENDS
The trends are mixed in FY 2024, with frequency, average paid and average incurred increasing while the litigation rate and overall aged pending are decreasing.
The new claim litigation rate overall decreased to 0.93% in FY 2024, driven primarily by tort reform in Florida, which dropped from 3.03% to 0.90%. Unfortunately, the new claim litigation rate in New York increased from 3.2% to 3.59%. The cost of litigated claims has continued to increase, most recently increasing 6.5%. The percentage of claims litigated earlier, including claims with representation in place before first notice, continues to increase. The cost of non-litigated claims increased 9.5% in FY 2024 after decreasing for the first time in several years in FY 2023. The average cost of litigated claims equals 14.5 times the relative cost of non-litigated claims.
Closure rates increased overall with BI claims experiencing the biggest increase in closure rates. Along with the increased closure rate, claim durations decreased by two days overall, with both BI (down two days) and PD (down one day) experiencing shorter durations. Aged pending also continued to decrease in FY 2024, dropping to its lowest mark in the last five years.
Unfortunately, claims in the higher incurred tiers continue to become more costly.
Industry concerns
The industry has several recurring concerns and one new unknown that could significantly impact stability and profitability. The recurring concerns include inflationary increases in medical care, increases in the cost of litigation, litigation financing and tort reform. The recent landmark decision of the United States Supreme Court in Loper Bright Enterprises, et al. v. Gina Raimondo, Secretary of Commerce, et al. creates some uncertainty in ancillary areas and will need to be closely monitored.
Increased claim costs
According to the Bureau of Labor Statistics, the cost of medical care has increased in consecutive months since August 2023, rising at a rate of 2.2% through March 2024. However, some healthcare prices are increasing at a faster rate, including hospital services (+7.7%) when compared to the cost of all goods and services (+3.5%).
The long-term average inflation rate is 3.28%. The Federal Reserve targets 2% inflation as a healthy rate for the U.S. economy.
Increased cost of litigation
The cost of liability litigation continued to increase in FY 2024. Three primary areas of concern continue to impact the industry:
1. Social inflation continues to drive the cost of litigation. A recent report from RAND Corporation noted the following (although RAND admits the results are not necessarily conclusive):
| • | Social inflation does not affect organizational defendants to a greater degree than non-organizational defendants. |
| • | Social inflation is not occurring equally in all states. The largest increases occurred in New York, California, New Jersey and Texas. |
2. Plaintiff attorney tactics continue to evolve. Tactics include jury anchoring, reptile theory and the expansion of premise liability negligence.
| • | Jury anchoring: A strategy employed to cause jurors to use a specific, often random, point of reference when evaluating damages in a lawsuit. Typically, it includes making references to corporate revenue or income as a starting point for damages. |
| • | Reptile theory: This strategy continues to inflame jury awards nearly 15 years after its emergence and requires additional defense planning and preparation, driving up litigation costs and claim payouts. |
| • | Expansion of premise liability negligence: These novel theories require additional legal strategies to overcome. |
3. Nuclear verdicts are still on the rise, according to a May 2024 study by the U.S. Chamber of Commerce Institute for Legal Reform.
| • | The median nuclear verdict overall was $89 million. |
| • | Product liability, motor accidents and medical liability cases continue to comprise two-thirds of reported nuclear verdicts. |
| • | State courts represented over 90% of all nuclear verdicts when compared to federal jurisdictions. |
| • | Nuclear fallout settlements, defined as an increase in perceived settlement value based on previous nuclear and thermonuclear verdicts, are contributing to the increase in average paid and average incurred. Using pooled judgment committees is important for establishing case value with more objectivity. |
Loper Bright Enterprises v. Raimondo, Department of Commerce, et al., one of the recent landmark cases impacting the Chevron deference, will most certainly impact risk management circles. While it is much too early to truly understand the full impact of the removal of this deference to administrative agencies in interpreting new laws, we can expect more litigation in certain arenas. Administrative agencies, which are established by the executive branch, are empowered to create guidelines, rules, processes and procedures to execute new laws, particularly where the statute is ambiguous. The Loper Bright decision will not change this responsibility. What will change, however, is the decision-maker regarding whether the guidelines, rules, processes and procedures established by those agencies are reasonable interpretations of the laws. The agencies in question include the National Highway Traffic Safety Administration, the Economic Development Administration, the Consumer Product Safety Commission and the Centers for Medicare and Medicaid Services (CMS). These agencies establish rules and guide ambiguities within the statutes that have an impact on the way many of our clients conduct business.

Consider Medicare set-aside agreements, which are often required in liability cases. CMS has developed guides to calculate Medicare set-aside amounts, as well as many other aspects of the process. Medicare set-aside agreements often include projected costs for prescription drugs from CMS that are based on unrealistic drug prices developed by drug manufacturers, also known as average wholesale prices (AWP).
The recent Loper Bright decision opens the door to challenge the use of AWP by removing the deference to the administrative agency that developed the guidelines. This is just one example in what will surely be a long line of challenges to administrative authority and one that Sedgwick is watching closely.
Litigation financing continues to be debated at both the state and federal levels. While there is movement in attempts to change the litigation financing industry, only Indiana, West Virginia, Wisconsin, Montana and Louisiana have passed legislation requiring transparency. There is proposed legislation in both the House and the Senate at the federal level, with the House Judiciary Committee having held a hearing on June 12, 2024, to debate third-party litigation funding. Following that hearing, Rep. Darrell Issa (R-CA-48) released a discussion draft of proposed legislation for all federal cases that ensures transparency around all parties where a litigation funder has invested in a lawsuit and will receive a payment based on the outcome.
Litigation financing is also playing a role in other aspects of our civil justice system, such as personal and mass torts. As the litigation funding industry evolves, distinctions are arising between litigation financing and consumer legal funding, and there is some debate about whether this distinction changes the impact. Consumer legal funding assists plaintiffs with ongoing daily living expenses in anticipation of an award, and litigation financing funds the prosecution of the plaintiff’s case. Both, however, charge interest and fees on top of the original amounts involved in the funding. Litigation financing will continue to be an active area of concern and will likely have additional legislation passed at both the state and federal levels.
Tort reform, particularly in Florida, is benefiting the insurance landscape. Sedgwick’s data shows that the rate of new lawsuits decreased by 3% through week 26 in 2024 over the same period in 2022. The data also shows a 70% decrease from the same period in 2023, though the significant rush to file lawsuits in Florida in 2023 is a big driver in that decrease. With 2024 being an election year, tort reforms historically take a back seat in priorities due to shortened legislative sessions and the controversial nature of the issue.
However, pending and proposed tort reforms (both expansive and restrictive) will be important to watch even in Florida as legislation is being pushed by the trial bar that would allow plaintiffs access to claim files of insurance companies. Other important tort reform issues across the country include premise liability reform, limits on non-economic damages in medical liability cases and third-party litigation funding.
CONCLUSIONS
Economic and social inflationary pressures are driving most of the increases in claim severities. There is no doubt that the volume and average severity increases in the top tier ($100,000+) are directly related to these pressures. When coupled with increases in litigation and the average cost of litigated claims being 14.5 times that of non-litigated claims, organisations must adapt and be responsive to these shifts. More timely and focused claim investigations will set the stage for better outcomes. The earlier that claims organisations can obtain evidence needed to assess liability and injury valuation, the more impactful that knowledge can be in seeking appropriate resolutions. Pooled judgment structures such as high-severity review committees will bring the additional perspectives needed to navigate claims in the highest tiers. Claims organisations should also consider beginning work earlier that’s usually completed post-suit, such as biomechanical engineers, incident reconstruction and jury focus groups. Mock trials are becoming less valuable and more expensive than jury focus groups, which allow for a town hall forum of questions and answers. However, mock trials still have a place in a defense strategy.
Corporations would also be well-served to identify corporate witnesses long before they are needed and train them on how to be a good corporate deponent. The defense industry needs to see our response to current conditions as a long-term strategy.
Sedgwick’s liability litigation observations and trends commentary, published in May of 2024, provides more in-depth analysis on the prevailing trends and practices in the liability landscape, including a deeper dive into plaintiff bar tactics, social inflation and the use of analytics in litigation management.