
Workers’ compensation
Report objectives
This report aims to summarize the present metrics for our U.S. workers’ compensation (WC) carrier programs, assess the current landscape of each claims market, and benchmark our patterns against comparable industry research.
data parameters
Our practice team uses JURIS claims data to perform comparative analyses informed by their expertise and analytics. The data in this report is based on both insured and self-insured claims for all states across five, 12-month periods (referred to as FY) from July 1, 2020, through June 30, 2024.
Claim volume
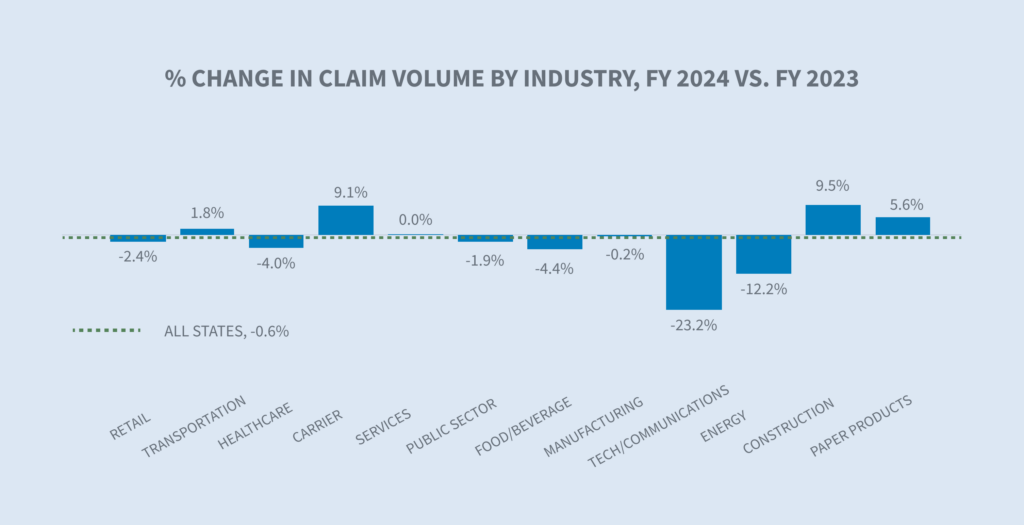
Sedgwick’s data for FY 2024 for all industries reflects a 0.6% decrease in total claim counts compared to 2023 when COVID-19 claims are included. Excluding COVID-19 claims, total claim counts increased 1.8% compared to 2023.
For the carrier group, total claim counts for FY 2024 rose by 9.1% compared to FY 2023, including COVID-19 claims, and by 10.1% when excluding COVID-19 claims.


From a labor market perspective, employment varies by industry as well as jurisdiction. According to the Bureau of Labor Statistics (BLS) Employment Situation Summary published Aug. 2, 2024, employment continued to trend up in healthcare, construction and transportation and warehousing. Sedgwick’s claim counts only increased in 2024 for the carrier, construction, paper products and transportation industries.
The share of indemnity claims (all industry groups) continued to decrease in FY 2024 equaling 21.9% (-0.3% from FY 2023). The carrier group increased slightly in FY 2024 to 24.1%.
Claim costs
There was a 14.8% increase in the average paid per indemnity claim in FY 2024 in comparison to FY 2023 (14.1% when COVID-19 claims are excluded) for the carrier group. Whereas, considering all industry groups the increase was 10.2% (9.4% when COVID-19 claims are excluded).

According to the BLS Employment Cost Index issued July 31, 2024, wages and salaries increased 6.5% for union workers for the 12-month period ending in June 2024 and 3.8% for non-union workers. In 2024, 22 states increased minimum wage according to The Economic Policy Institute minimum wage tracker, raising pay for an estimated 9.9 million workers.
Indemnity benefit payments, which are calculated based on wages earned, increased 5.7% per indemnity claim in 2024 in comparison to all industry groups at 5.1% in FY 2024. Our TTD paid per day inflation analysis indicated a 3.8% increase for FY 2024 compared to FY 2023. The construction, public sector and transportation industries experienced the largest increases at 10.9%, 5.2% and 5.1%. The carrier group increased 4.4%.

Medical costs
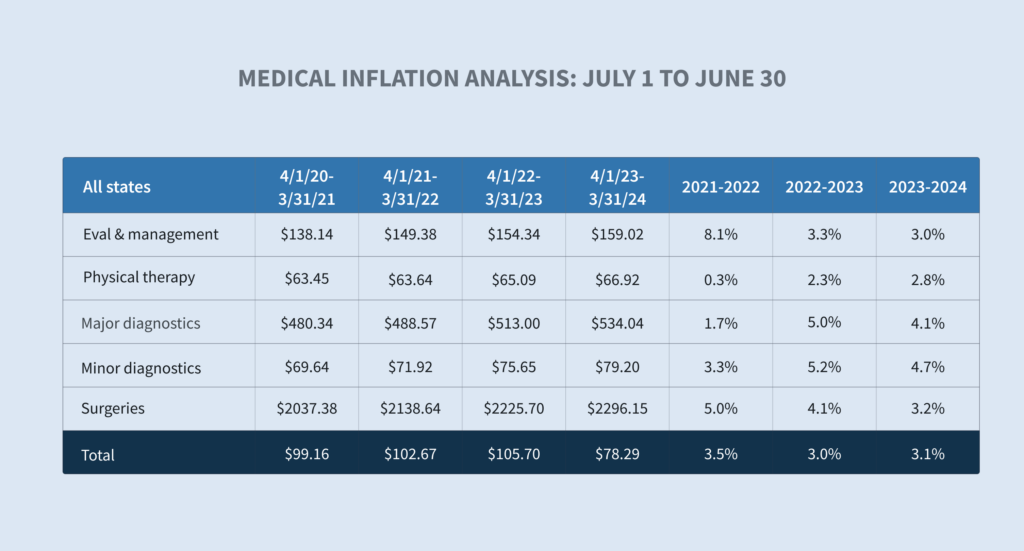
In the carrier group, average medical services paid per indemnity claim increased 13.4% in FY 2024 relative to FY 2023. All industry groups increased 9.5% in FY 2024 relative to FY 2023. Our medical inflation analysis indicated a 3.1% increase in the price per service change between FY 2023 and FY 2024.
Average medical services paid per indemnity claim in FY 2024 compared to FY 2023 for the carrier group:
| • | Physician services (evaluation and management) + 9.5% |
| • | Hospital in-outpatient + 4.5% |
| • | All other +40% |
While most WC medical costs are controlled by state fee schedules, services not covered by fee schedules like durable medical equipment (DME), attendant care, long-term care and transportation are seeing significant cost increases.
Closures
The percentage of all new claims closed for the carrier group in FY 2024 increased 2.3% over FY 2023, surpassing the closure rates for the last four years. The percentage of all claims closed for all industry groups also saw a slight increase in both overall and indemnity categories.

The average duration on closed claims for the carrier group decreased for all claim types achieving its lowest level for the time periods reviewed. For all industry groups, the average durations were stable for FY 2024 in comparison to FY 2023.
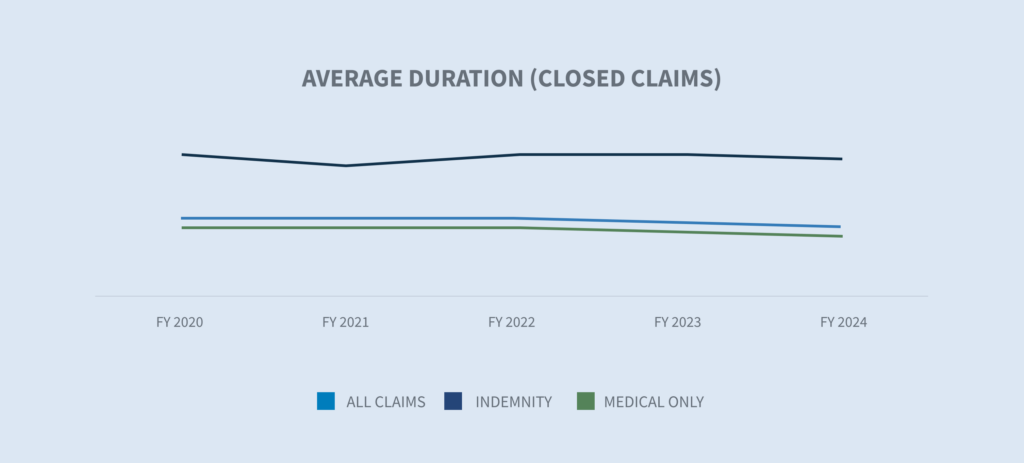
According to the WCIRB California’s “2024 State of the System” report, California continues to experience longer average claim durations compared to other states, driven by slower claim reporting, lower settlement rates and higher frictional costs, particularly medical-legal costs.
Expense costs and litigation
For carriers, FY 2024 average expenses paid increased in medical cost containment (+9%), legal fees (+9.4%) and in all other (+16%) while decreasing in medical legal (-1%). When evaluating all industry groups, average expenses paid increased in each of the reflected categories, with the largest increases in medical cost containment (+9.6%) and legal fees (+8.2%).

Aside from attorney fees legal fees are driven by court costs, court reporters, deposition, photocopies and non-medical witness fees.
For the carrier group, litigation rates continued to increase incrementally in FY 2024, increasing to 1.3% for all claims and 7.4% for indemnity claims only. Overall, the claim litigation rates for indemnity claims has shown incremental increases in the post-pandemic era. The WCIRB California’s “2024 State of the System” reports a sharp rise in average allocated loss adjustment expense driven by increased litigation across the state.
The ratio between litigated claim costs and non-litigated costs has remained relatively consistent over the past several years.

Future considerations for workers’ compensation
Workers’ compensation is witnessing transformative changes that are being closely monitored.
Labor market shifts
As labor trends change, attention to safety, training and return-to-work programs becomes more important than ever.
| • | Shortened average job tenure due to workers moving into new jobs, occupations and industries tends to increase injury frequency and may also affect injury severity. |
| • | Demographic shifts, such as a change in the age distribution of workers in certain industries due to early retirement, may also affect injury frequency and severity. |
Medical accessibility/costs
To contain medical costs going forward, it is critical that medical costs and utilization continue to be managed using controls developed in recent years. Medical costs and severity are expected to increase in the future driven by:
| • | The National Center for Health Workforce Analysis estimates a shortage of up to 81,180 full-time physicians in 2035. There is also a projected shortage of RNs through 2030. |
| • | Increased use of nurse practitioners (NPs) and physician assistants (PAs) is expected to mitigate shortages in some specialties. These professions, including RNs, are expected to have excess by 2035. |

| • | The talent shortage in the healthcare industry is resulting in increased labor costs for health systems and hospitals that are expected to be passed on to payers and consumers through higher prices and increased utilization. |
| • | Medical advances are often effective in improving outcomes, but they tend to be costly. |
Heightened regulatory environment
| • | Several states enacted legislation that increased workers’ compensation benefits for injured employees, although this applied to only first responders in Colorado, Florida and Ohio. |
| • | Multiple states expanded presumptions for first responders to either add additional conditions or make additional first responders eligible. These laws historically are applied to local public entities or certain state and federal agencies, although they sometimes apply to some private sector employees or volunteers. |
| • | Penalty exposure continues to increase due to enacted legislative and regulatory changes, along with enhanced electronic monitoring of performance. |
Court decisions
On June 28, 2024, the U.S. Supreme Court decision in Loper Bright Enterprises v. Raimondo (No. 22-451) overruled a long-standing requirement dating back to 1984, the Chevron doctrine, that courts must defer to federal agencies’ reasonable interpretations of ambiguous statutes. The high court held that the Administrative Procedure Act (APA) requires courts to exercise their independent judgment in deciding whether an agency has acted within its statutory authority.
This decision will have a significant impact on how lower courts will evaluate challenges to any regulation issued by any regulatory agency, including:

| • | New DOL regulations |
| • | New Federal Trade Commission non-compete agreement ban |
| • | New OSHA Heat Injury and Illness Prevention in Outdoor and Indoor Work Settings standard |
| • | Centers for Medicare and Medicaid Services methods of protecting Medicare’s interest in WC cases |
| • | Interpretation of the Longshore Act and its extensions by the Director of the Office of Workers’ Compensation Programs |
A risk to monitor is the potential for inconsistency due to different courts interpreting the same regulation differently.
