
Liability
Report objectives
This report aims to summarize the present metrics for our U.S. general liability (GL) and motor liability (AU) carrier programs, assess the current landscape of each claims market, and benchmark our patterns against comparable industry research.
data parameters
Our practice team uses JURIS claims data to perform comparative analyses informed by their expertise and analytics. The data in this report is based on both insured and self-insured claims for all states across five, 12-month periods (referred to as FY) from July 1, 2020, through June 30, 2024.
General liability
Claim volume
GL carrier group new claim volume increased 10.1% in FY 2024 in comparison to FY 2023. As to the top industry group representation as a percent of overall new claim volume: retail 64%; technology/communication 12%; carrier 6%; energy 6%; and services 4%. All industry groups GL claim volume increased 1.9% for FY 2024.


The five states generating the highest volume of new GL claims are: California (+8%), Florida (+13%), Texas (+13%), Massachusetts (+4%) and New York (-5%). Combined, they account for 45% of the GL new claim volume for the carrier group.

Denial rates for the carrier group increased in FY 2024 to 21.1% in comparison to FY 2023. This uptick in denial rates is consistent with all industry groups, which increased to 24.5% in FY 2024. The average incurred decreased for both new denied claims (-3%) and non-denied (accepted) claims (-10%). In contrast to all industry groups where the average incurred on new denied claims decreased 22.9% while increasing 5.5% on new non-denied (accepted) claims for FY 2024 in comparison to FY 2023.

Costs
Average paid for the overall book for new claims has continued to increase across all new GL claims — rising 36.1% since FY 2020. In FY 2024, the average paid across all new claims increased 8.6 %. For the carrier group, the average paid for all new claims increased 17% (+16% for BI) in FY 2024 compared to FY 2023 and has increased 23% (+22% for BI) since FY 2020. For the top five states with the highest volume, California, New York and Illinois all experienced a decrease in average paid per new claim; Florida and Texas experienced double digit increases (consistent with our all-industries group).


For the carrier group, the average incurred loss for all new GL claims decreased 12% with BI claims decreasing 23%, primarily driven by decreases in the loss category. The all-industries group experienced an increase of 1.8% (-2% for BI) in FY 2024 compared to FY 2023.
For FY 2024 carrier group new claims, those within the $100K+ tier decreased by 11%, the $25K to $100K tier increased 6%, and all other tiers remained flat or decreased slightly compared to FY 2023.


Litigation
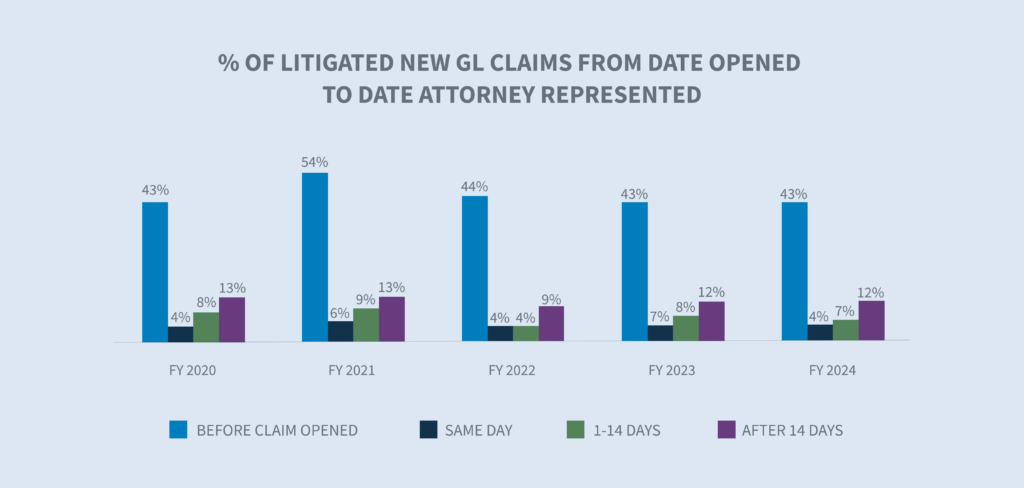
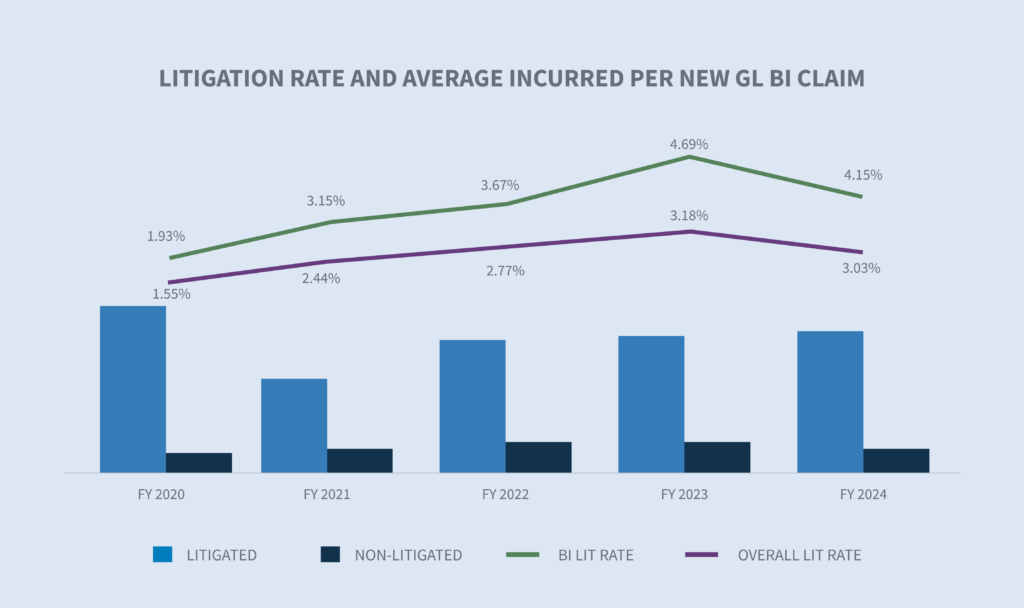
For the carrier group, the litigation rate for new claims decreased to 3.03% (4.15% for BI) for FY 2024 (litigation rate for the overall book equals 0.93% — 1.8% for BI). The decrease was driven by the wave of lawsuits filed in Florida before the March 2023 effective date of their tort reform. Forty-seven percent of all claims that will at some point involve litigation have attorney representation already in place within the first 24 hours of investigation. This attorney representation rate has remained steady over the last several years while for the overall book it is increasing incrementally with the First Notice of Loss.
As with the all-industries group, New York remains the top state for litigation at 9.7%. The other top volume states (California, Florida, Texas and Massachusetts) are at or below 3%.
FY 2024 average incurred on new BI litigated claims for the carrier group increased 4% (all-industries group +8%) over FY 2023. The overall cost of claims continues to increase with litigated claims incurred values over eight times that of non-litigated claims.
Litigation aged pending has been relatively flat for the last 3 years. FY 2024 saw a decrease of 5% in the overall claim count in aged pending with a reduction to 20% of the total inventory. This reduction for the carrier group was driven by a 22% reduction in non-litigated aged claims. Aged pending inventory is at its lowest mark in the last five years.

The carrier group liability closure rates for FY 2024 new claims increased 10% over the same period last year (BI +17% and PD +4%) achieving the highest closure rates since FY 2020.

The average duration of all GL claims decreased by three days (BI -7 days and PD +1 day).
In the carrier group, litigated claims currently represent 15% of the total closed claim volume yet account for 61% of the total dollars paid on closed claims. The average paid for a litigated claim increased 12% in FY 2024. The average paid on non-litigated closed claims decreased 4%. The average cost of a litigated carrier claim is eight times greater than the cost of a non-litigated claim. In FY 2024, 7% of the volume of closed claims fell into the $100K and above incurred tier, down slightly from FY 2023.

motor liability
New claim volume for the carrier group increased 46.6% in FY 2024. For all industry groups, new claim volume increased 7.4% in FY 2024 following volume increases of 10.6% in FY 2023 and 7.6% in FY 2022.

The top five-volume states represent 47% of all new motor claims. New Jersey had the largest increase at 247%. Overall, new motor claims increased 7.4% countrywide.

The carrier group average incurred for denied new claims decreased 61% in FY 2024 (all industry groups -46%) compared to FY 2023. However, FY 2023 was an exceptional year for denied average incurred after having risen 140% from FY 2022 (all industry groups +110%) from FY 2022. Non-denied (accepted) new claims average Incurred decreased 8% whereas for all industry groups it rose 10% from FY 2023. The denial rate in FY 2024 increased to 7.8% (all industry groups increased to15.4%).

Costs
All new motor claims (all industry groups) average paid increased 5.9%, driven by BI claims (+55.1%). For the carrier group, new motor claims average paid decreased 12%; however, considering only BI claims, a 22% increase was seen in FY 2024 compared to FY 2023.

For the carrier group, the average incurred for all new AU claims decreased 11% with BI claims decreasing 8.5% for FY 2024 in comparison to FY 2023. Although showing a decrease in FY 2024, the average incurred still shows an increase of 9% (all claims) and 31% (BI claims) since FY 2020. For all industry groups, the average incurred for all new AU claims has increased 56% since FY 2020, although moderating in FY 2024 to an increase of 6.1%. For BI claims, the increase was 7.6% in comparison to FY 2023, which is up 94% since FY 2020.
For FY 2024 new claims, those within the $100K+ tier decreased by 18% and the $25K to $100K tier increased 13%. All other tiers remained flat or decreased slightly compared to FY 2023.

Litigation
For the carrier group, the litigation rate for new claims decreased to 0.57% (3.63% for BI) for FY 2024 (the litigation rate for all industry groups is 0.62% (4.14% for BI)). The decrease was driven by the wave of lawsuits filed in Florida before the March 2023 effective date of their tort reform. Forty-seven percent of all claims that will at some point involve litigation have attorney representation already in place within the first 24 hours of investigation.

As with the overall book, New York remains the top state for litigation at 2.3% in FY 2024. The other top volume states (California, Texas, New Jersey, New York, Rhode Island and Massachusetts) are below 1%.
FY 2024 average incurred on new AU BI litigated claims for the carrier group increased 1% (all industry groups +25%) over FY 2023.

FY 2024 saw a decrease of 13% in the overall claim count in aged pending with a reduction to 7.8% of the total inventory. This reduction for the carrier group was driven by a 42% reduction in non-litigated aged claims whereas litigated aged pending increased 31%. Aged pending inventory is at its lowest mark in the last five years.

Closures
The carrier group AU overall closure rates for FY 2024 new claims decreased by 7% compared to FY 2023. AU BI claims remained flat and AU CL closure rates increased 2.4%. The AU PD new claim closure rate decreased 5.5%.

For the carrier group, the average duration of all AU claims remained flat for FY 2024 in comparison to FY 2023.
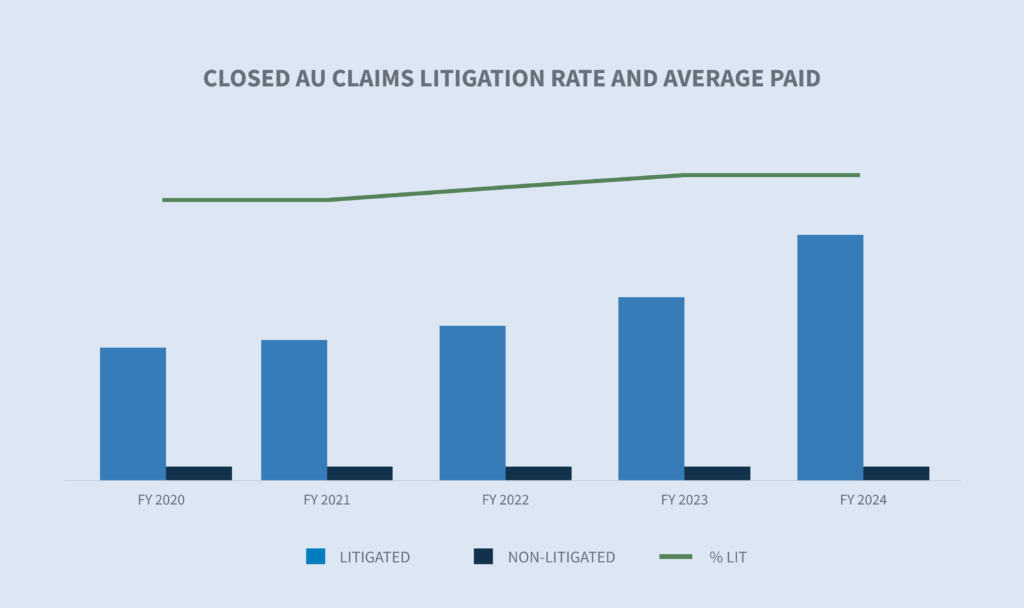
In the carrier group, AU litigated claims currently represent 2.6% of the total closed claim volume yet account for 40% of the total dollars paid on closed claims. The average paid for a closed litigated claim increased 29% in FY 2024. The average paid on non-litigated closed claims decreased 11%. The average cost of a closed litigated carrier claim is 24 times greater than the cost of a closed non-litigated carrier claim. In FY 2024, 2% of the volume of closed claims fell into the $100K and above incurred tier, flat in comparison to FY 2023.
Future considerations for liability
Industry concerns
The industry has several recurring concerns and one new unknown that could significantly impact stability and profitability. The recurring concerns include inflationary increases on medical care, wages and vehicle repair; driving behaviors; the continuing increases in the cost of litigation; litigation financing; and tort reform. The recent landmark decision of the U.S. Supreme Court in Loper Bright Enterprises, et al. v. Gina Raimondo, Secretary of Commerce, et al. creates some uncertainty in ancillary areas and will need to be closely monitored.
Increased claim costs
According to the Bureau of Labor Statistics, the cost of medical care has increased in consecutive months since August 2023, rising at a rate of 2.2% through March of 2024. However, some healthcare prices are increasing at a faster rate including hospital services (+7.7%) when compared to the cost of all goods and services (+3.5%).
Current inflation rate dropped below to 2.97% in June 2024 — the first time in 12 months below 3%. The long-term average inflation rate is 3.28%.

CCC in their “2024 Crash Course Report” for Q2 made several observations of trends identified in 2024:
| • | Total loss frequency is up 1.6% year over year due to continued erosion of used vehicle values and an increasingly aged vehicle pool where 73% of valuations are for vehicles seven years or older. |
| • | An increase in total loss frequency should relieve pressure on shop capacity and lower overall cycle times. |
| • | Total cost of vehicle repair increased at 3.3% relative to the prior quarter. |
| • | According to the U.S. Bureau of Labor Statistics, vehicle maintenance and repair costs have risen by 23% since 2022. |
Driving behavior
The Federal Highway Administration reports driving activity continues to increase on all roads and streets, up 1.3% over the prior 12 months as of May 2024 with more of those miles occurring on urban highways. The Travelers Companies 2024 Risk Index on distracted driving underscores concerns which are making roadways less safe. The report lists some common distractions that are on the rise including:
| • | Updating or checking social media |
| • | Typing a text or email |
| • | Talking on a cellphone |
| • | Using a cellphone to record videos or take photos |
| • | Reading a text or email |
The report further identifies business concerns with employees’ use of mobile technology while driving and 68% of those executives surveyed said they have instituted distracted driving policies.

Increases in the cost of litigation
The cost of liability litigation continued to increase in FY 2024. Three primary areas of concern continue to impact the industry:
1. Social inflation continues to be a driver of the cost of litigation. A recent report from RAND Corporation noted the following (although RAND admits the results are not necessarily conclusive):
| • | Social inflation does not affect organizational defendants to a greater degree than non-organizational defendants. |
| • | Social inflation is not occurring equally in all states. The largest increases occurred in New York, California, New Jersey and Texas. |
2. Plaintiff attorney tactics continue to evolve. Such tactics include:
| • | Jury anchoring: A strategy used to cause jurors to use a specific, often random, point of reference when evaluating damages in a lawsuit. Typically, it includes making references to corporate revenue or income as a starting point for damages. |
| • | Reptile theory: This strategy continues to inflame jury awards nearly 15 years after its emergence and requires additional defense planning and preparation driving up litigation costs as well as claim payouts. |
| • | Novel theories of liability for motor claims, including expansion of vicarious liability: These novel theories require additional legal strategies to overcome. |
3. Nuclear verdicts: A May 2024 study by The U.S. Chamber of Commerce Institute for Legal Reform concluded that nuclear verdicts are still on the rise.
| • | The median nuclear verdict overall was $89 million. |
| • | Product liability, motor accidents and medical liability cases continue to comprise two-thirds of reported nuclear verdicts. |
| • | State courts represented over 90% of all nuclear verdicts when compared to Federal jurisdictions. |
| • | Nuclear Fallout Settlements, defined as an increase in perceived settlement value based on previous nuclear and thermonuclear verdicts, are contributing to the increase in average paid and average incurred. Use of pooled judgment committees are important to establishing case value with more objectivity. |
Court decisions
On June 28, 2024, the U.S. Supreme Court decision in Loper Bright Enterprises v. Raimondo (No. 22-451) overruled a long-standing requirement dating back to 1984, the Chevron doctrine, that courts must defer to federal agencies’ reasonable interpretations of ambiguous statutes. The high court held that the Administrative Procedure Act (APA) requires courts to exercise their independent judgment in deciding whether an agency has acted within its statutory authority.
This decision will have a significant impact on how lower courts will evaluate challenges to any regulation issued by any regulatory agency, including:

| • | New DOL regulations |
| • | New Federal Trade Commission non-compete agreement ban |
| • | New OSHA Heat Injury and Illness Prevention in Outdoor and Indoor Work Settings standard |
| • | Centers for Medicare and Medicaid Services methods of protecting Medicare’s interest in WC cases |
| • | Interpretation of the Longshore Act and its extensions by the Director of the Office of Workers’ Compensation Programs |
A risk to monitor is the potential for inconsistency due to different courts interpreting the same regulation differently.
CONCLUSIONS
For liability claims, inflationary pressures — both economic and social — are driving most of the increases in claim severities. There is no doubt that the volume and average severity increases in the top tier ($100,000+) are directly related to these pressures. When coupled with the increase in litigation and the average cost of litigated claims being between 28 to 30 times that of non-litigated claims, organisations must adapt and be responsive to these shifts. More timely and focused claim investigations will set the stage for better outcomes. The earlier that claims organisations can obtain evidence needed to assess liability and injury valuation, the more impactful that knowledge can be to seeking appropriate resolutions.
Pooled judgment structures such as high-severity review committees will bring additional perspectives needed to navigate claims in the highest tiers. Claims organisations should also be considering beginning work earlier that’s usually completed post-suit, such as biomechanical engineering, accident reconstruction and jury focus groups. Mock trials are becoming less valuable and more expensive than jury focus groups, which allow for a type of town hall forum of question and answers. Corporations need to review their own internal policies, procedures, training materials and social media channels with an eye towards litigation because this is where those items are showing up and having a negative impact. Corporations would also be well-served to identify corporate witnesses long before they are needed and train them how to be a good corporate deponent. The defense industry needs to see our response to current conditions as a long-term strategy.
