
- 2024 year-end: CASUALTY
Auto liability
Report objectives
This report aims to summarize the present metrics for our auto liability (AU) programs, assess the landscape of auto claims and litigation and benchmark our patterns against comparable industry research.
data parameters
Our practice team uses JURIS claims data to perform comparative analyses informed by their expertise and analytics. The data in this report is based on both insured and self-insured claims for all states across five, 12-month periods (referred to as CY) from Jan. 1, 2020, through Dec. 31, 2024.
Key observations
The rate of new auto liability and bodily injury claims was 13.4% for CY 2024, up from 12.5% in CY 2023.
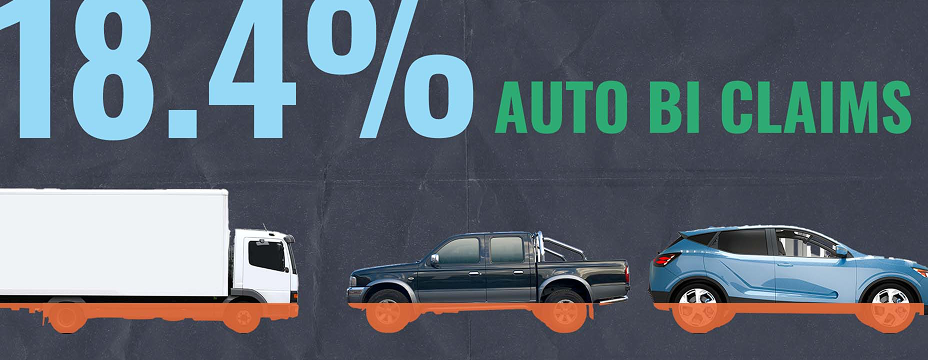
| • | The transportation industry experienced the highest rate of new auto liability and bodily injury claims at 18.4%. |
New auto liability claim durations decreased in CY 2024.
| • | Average duration from open to close for new auto liability and bodily injury claims decreased by 5 days. |
Average incurred on new auto liability claims rose 17.8% in CY 2024.
| • | Average incurred on new auto liability and bodily injury claims rose 18.1% in CY 2024. |
Litigation rates for all new auto liability claims increased to 0.60%.
| • | The rate for new auto liability and bodily injury increased to 3.71%. |
| • | The rate for pending auto liability and bodily injury claims was 15.0%. |
The average incurred for new litigated auto liability and bodily injury claims decreased 8.1%.
| • | The average incurred for non-litigated auto liability and bodily injury claims increased 20.5%. |
| • | New litigated auto liability and bodily injury claims were 4.8x greater than the average incurred on non-litigated claims. |
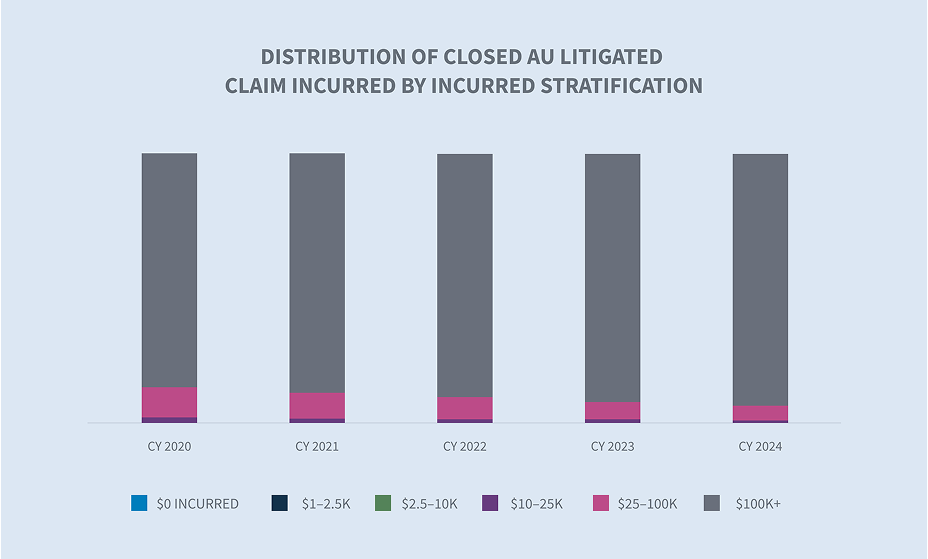
Closed auto liability claims with incurred above $100,000 represent 1.9% of all closed claims in CY 2024 and 71.3% of all incurred.
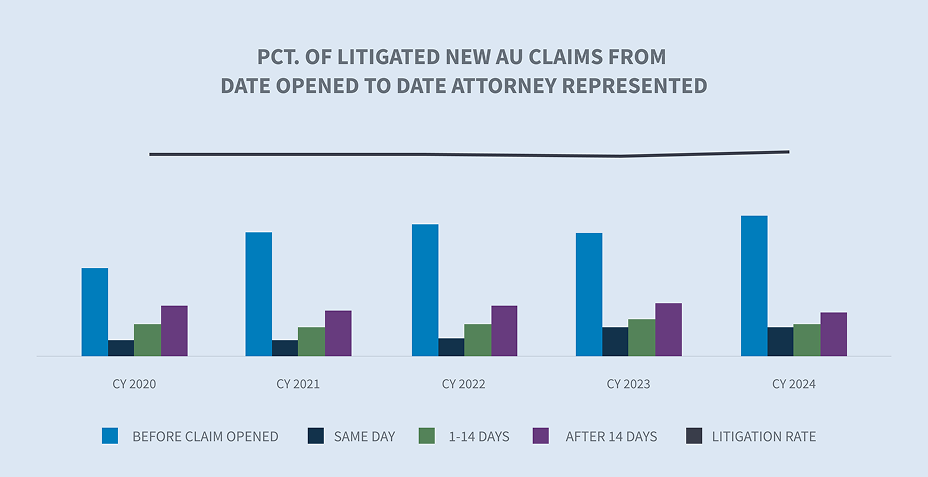
Looking at auto claims that ultimately became litigated, 63.6% had representation in place at the time of notice and within 24 hours of receipt; and 75.5% had representation in place within 14 days.
Aged pending decreased to 11.1% in CY 2024. Litigated claims accounted for 64.2% of the total aged pending.
Closure rates on new auto liability and bodily injury claims increased in CY 2024.
Closed litigated claims accounted for approximately 3.59% of all closed auto claims and comprised 55.3% of the total paid.
Market
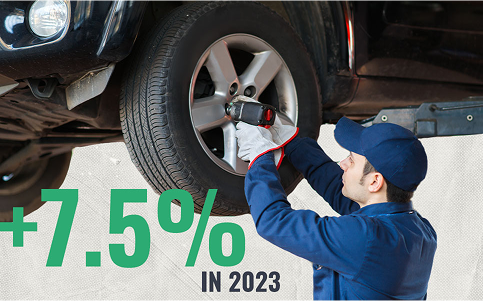
The primary driver of overall repair cost increases in 2023 and 2024 has been labor rates, which were up 7.5% in 2023 with a 4.7% increase year-over-year through Q3 2024. CCC Crash Course Report Q4 2024
While material damage inflation has cooled, the combined effects of auto medical billing inflation and social inflation continue to adversely affect auto casualty lines. CCC Crash Course Report Q4 2024
In Q4 of 2024, casualty insurance rates in the United States rose by 11% when excluding workers’ compensation. Marsh McLennan
85% of claimants reported being approached by one attorney following an auto accident and 60% reported being approached by two or more attorneys. LexisNexis 2024 Auto Trends Report
Volume
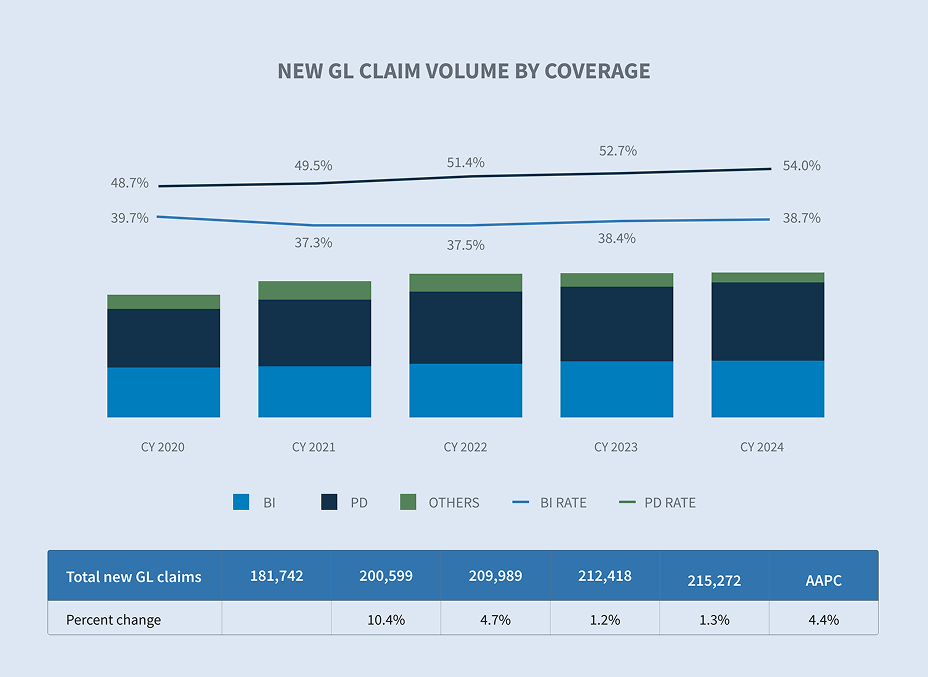
New claim volume increased 13.2% in CY 2024 following subsequent volume increases of 14.0% in FY 2022 and 17.5% in CY 2023. The increase was driven by bodily injury claims which rose 21.2%.
The top five volume states represent 41% of all new auto claims. New Jersey once again had the largest increase of claim volume at 53.7% followed by New York (+16.5%), Florida (+16.4%), Texas (+13.0%) and California (+12.6%).

Several industries experienced increased claim frequencies in CY 2024 including carrier claims (+39.5%), transportation claims (+13.9%), services claims (+9.3%) and manufacturing claims (+3.1%). Two industries experienced declines in new claims including food and beverage (-11.4%) and retail (-6.2%).

The rate of new bodily injury auto claims was 13.4% for CY 2024 versus 12.5% in CY 2023. Most major industries reported a double-digit rate of new bodily injury claims. Industries including transportation (18.4%), carrier (13.1%), manufacturing (12.4%) and services (10.8%) all experienced double-digit rates, while food and beverage (8.1%) and retail (8.9%) experienced single digit bodily injury rates.
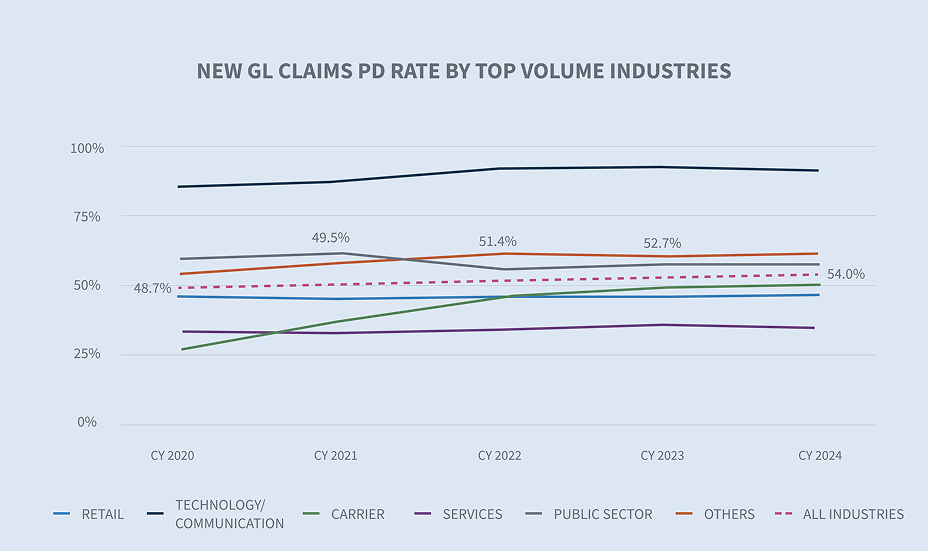
The overall property damage rate declined in CY 2024 to 54.7% from the CY 2023 rate of 55.7%. While most industries experienced a decline, retail (+10.5%) and carrier claims (+0.7%) saw growth in their property damage rates.

Claims durations are continuing to decrease for both open/closed claims and for closed claims only. Bodily Injury claim durations decreased by 5 days for open/closed new auto liability claims and by 4 days for closed new auto liability claims.

Costs
The average incurred for all new auto liability claims increased 17.8% in CY 2024 and has been steadily increasing since CY 2020 with an average annual percentage change of 12.6% each year. There was a significant increase, from a percentage perspective, in the average expense incurred in CY 2024, which was up 32.2% from last year. The increase in average incurred was driven by bodily injury claims (+18.1%) in comparison to CY 2023 and had an average annual percentage change of 17.6% since CY 2020.

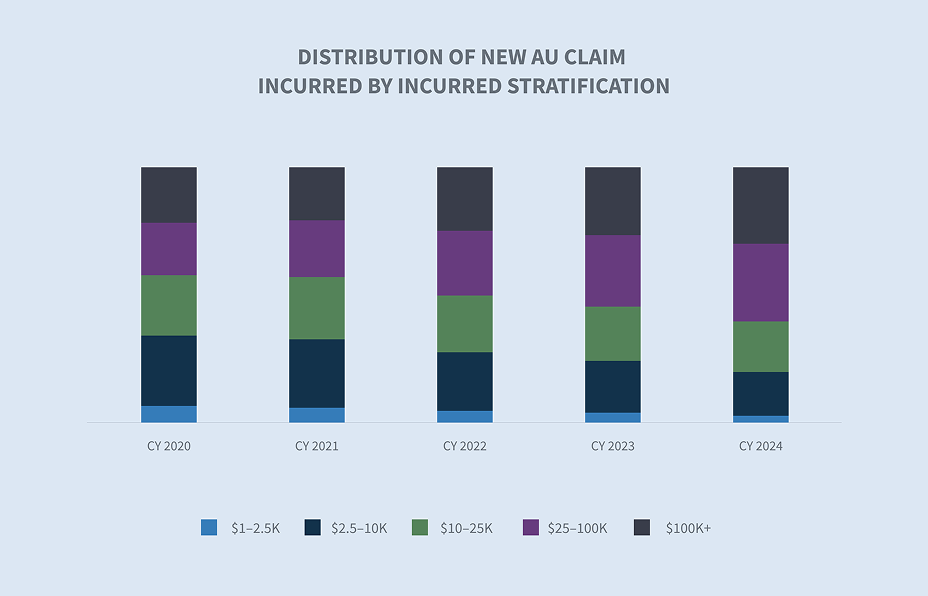
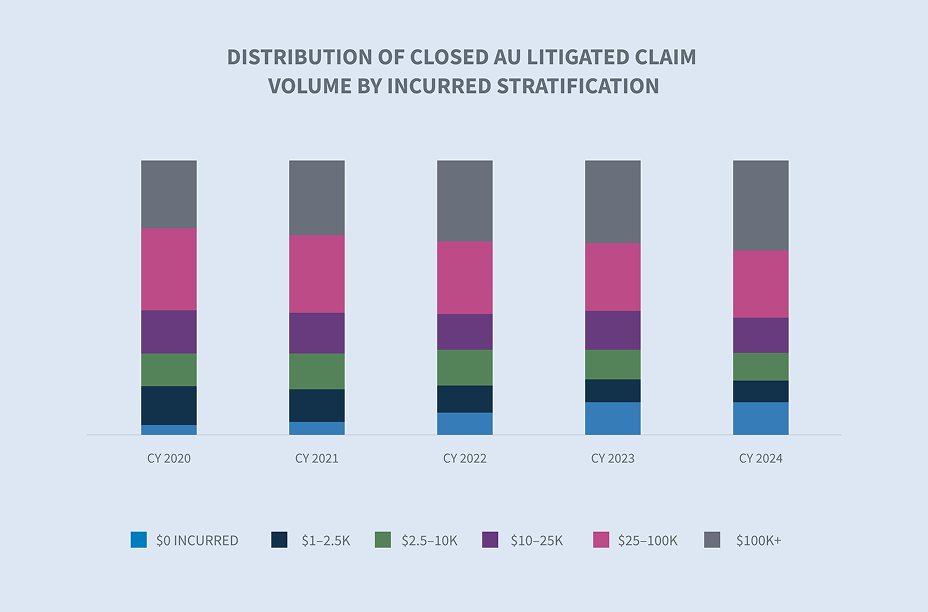
The higher tier incurred groups continued to see slight increases in the volume of claims thereby driving the overall incurred value increase. The $100k + stratification increased in volume to 0.6% in CY 2024. This small volume of claims now represents 34% of the overall incurred in FY 2024, representing a 6.21% increase from FY 2023.

For all new auto claims, the average paid increased 6.3%, driven by bodily injury claims, which are up 27.7%. Average paid for new auto claims has been increasing at an annual average percentage rate of 5.8% since CY 2020 while bodily injury claims are increasing at more than twice that rate with an annual average percentage increase of 13.0%.

Both Florida and Georgia had significant increases in their average paid per new auto liability bodily injury claim. However, Georgia’s average annual percentage change since CY 2020 is greater than Florida’s at 39.2%, underscoring why tort reform is badly needed. Other states seeing double-digit average annual percentage change include Texas (+31.3%), Florida (+28.7%) and New York (+21.9%). These large increases were driven by claims over $500K in each state. By comparison, the average annual percentage change for all other states was 8.2% for bodily injury claims.

The average paid per new auto liability bodily injury claim has increased across all industries by 27.7%. However, new auto liability bodily injury claims in the transportation industry led that increase at +111.4% when compared to CY 2023. The food and beverage industry (-8.0%) and public sector (-48.5%) saw the greatest decreases from CY 2023. The transportation industry had an average annual percentage change of +43.9% since CY 2020.

Litigation
Early attorney representation continued to drive litigation. Of the claims that became litigated, 63.6% had representation in place within 24 hours of first notice, and 75.5% of all claims that became litigated had representation in place within 14 days. These both represent five consecutive years of increases from CY 2020.

For new auto liability claims, the average litigation rate across all industries was 0.60%, an increase from CY 2023. The transportation sector continued to have the highest litigation rate at 0.88%.
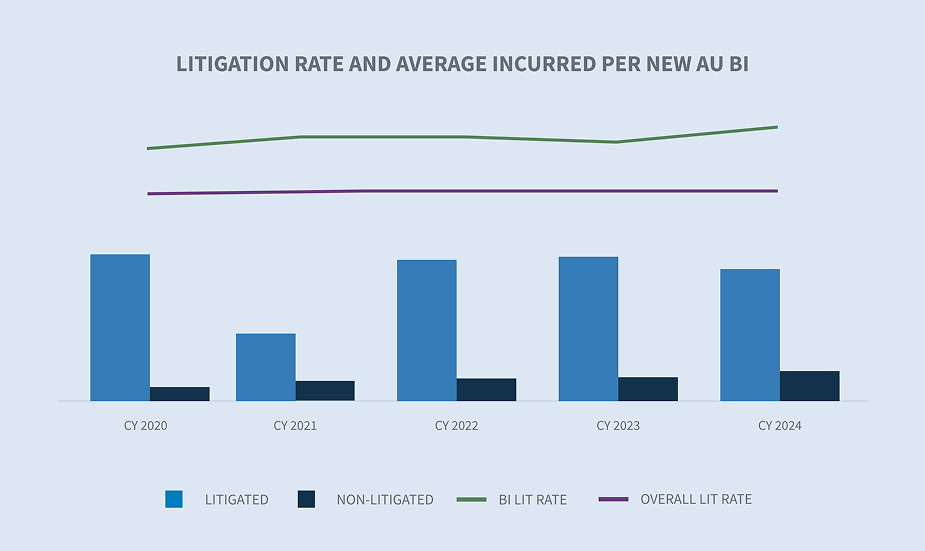
The litigation rate for new auto liability bodily injury claims increased to 3.71%. The average Incurred on new auto liability bodily injury litigated claims decreased by 8.1%. However, the average incurred in non-litigated new auto liability bodily injury increased 20.5%. Average incurred on new auto liability bodily injury litigated claims are 4.8x greater than non-litigated claims. For pending auto liability bodily injury claims, the litigation rate increased to 15.0%. The average incurred for pending auto liability bodily injury claims increased 15.3%.


The average paid on closed auto liability litigated claims increased 27.0%. The average annual increase in closed auto liability litigated claims is 15.5% since CY 2020. The average paid on a closed auto liability litigated claim is now 33.3x more than a non-litigated claim. The gap between litigated and non-litigated average paid for a closed claim is widening year over year. Even though closed litigated auto liability claims only represented 3.59% of all closed claims, they accounted for 55.3% of all closed paid amounts.
The increase in average paid on closed auto liability litigated claims is driven by the stratification of claims over $100k. The $100k+ tier represented 94% of closed auto liability litigated claims incurred even though that same tier represents only 32% of the closed auto liability litigated claims volume.
At the same time that average paid and average incurred for litigated claims increased, the average attorney costs for new auto liability bodily injury claims decreased 22.6%.

Closings
Closures for all new auto liability claims increased by 1.0%. That increase was driven by an increase in the percentage of new auto liability bodily injury claims, which increased 17% and collision claims, which increased 4%.

Overall, aged pending claims decreased to 11.1% in CY 2024 driven by a reduction in non-litigated aged pending which decreased by 10.3%. Litigated claims now account for 64.2% of aged pending.

Closed auto liability claim stratifications by volume and incurred amounts reveal the top tier of $100k+ has 1.9% of the volume but represents 71.3% of the closed incurred. This segment has risen 21.5% since CY 2023.
Future considerations
Consistent with the overall industry, Sedgwick’s auto claims data reflects:
| • | Average Incurred for auto claims are increasing in most major categories |
| • Average incurred on new auto liability claims increased 17.8%. | |
| • Average incurred on new auto liability bodily injuryclaims increased 18.1%. | |
| • Average incurred on pending new auto liability bodily injury claims increased 15.3%. | |
| • | Attorneys are getting involved in claims much faster than ever and the majority of claims that will become litigated have representation within 1 day of reporting, and 75% have representation within 14 days. |

| • | Aged pending claims are declining year over year with a healthy balance of litigated to non-litigated claims |
| • | The relative average paid of a closed litigated auto liability claim is 33 times that of the average paid of a closed non-litigated auto liability claim. |
| • | Larger claims ($100k+) are increasing in frequency and in severity. |
| • The top tier of $100k+ has 1.9% of the volume but represents 71.3% of the closed incurred. | |
| • This tier has risen 21.5% since CY 2023. | |
| • | Similar to our last state of the line report on auto claims, increased claim payment costs continue to be exacerbated by external factors including: |
| • Inflation | |
| • Rising medical costs | |
| • Rising repair costs | |
| • Complexity of repair costs (technology) | |
| • | Closure rates increased on new auto liability bodily injury claims |
INDUSTRY CONCERNS
The auto casualty industry is continuing to be negatively impacted with increases in general claim costs and in the cost of litigation. Collectively, these factors create a challenging environment for auto liability claim results. Excluding medical malpractice verdicts, commercial auto liability cases were responsible for the most nuclear verdicts in 2024.
Increased claim costs
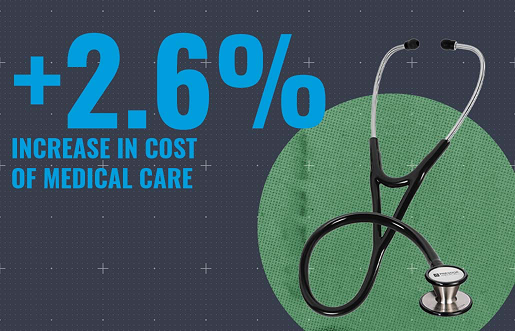
According to the Bureau of Labor Statistics, the cost of medical care has increased by 2.6% over the 12 months ending in January 2025. Hospital services continue to outpace the rate of increases in other medical services and general inflation rates.
Current inflation rate rose to 3.0% in January 2025 after having fallen below 3.0% late in 2024.
An aging vehicle fleet had significant impact on total loss frequency. CCC reports that vehicles seven years or older now make up 45% of all repairable claims.
The cost of liability litigation (including loss costs) continued to increase in CY 2024. Three primary areas of concern are reflective of the same headwinds faced by the industry for the last 2 to 3 years: social Inflation, Plaintiff attorney tactics and disproportionate verdicts (i.e. nuclear verdicts). None of these headwinds are new and should not surprise anyone in the industry. However, more important than what these headwinds are, is what the industry is doing and should be doing to mitigate them. The use of analytic AI to provide insights and predictions in the form of attorney scorecards, predictive severity models and historical jurisdictional analysis is no longer a ‘nice to have’ when shaping litigation strategy. Sedgwick has 10 years of lawsuit data analyzed for outcomes by federal/state jurisdiction and trial court levels, which can be used to provide insights and predictions. Look for more information on this in our upcoming liability litigation commentary paper. Partnering with litigation support entities that can conduct focus groups and juror analysis long before suits are ever filed can help with understanding the true value of a claim. Use of generative AI can be an adjuster’s best friend by summarizing demand packages, writing common status reports and freeing the adjuster to focus on defense strategies.
Litigation financing continues to be an issue that will have to be addressed legislatively but the industry can take several steps to raise awareness to the impacts on legal costs, policyholder premiums and the overall claims process. Discovery requests should be made in every lawsuit to provide transparency on who is funding a lawsuit and who seeks to benefit from any settlement or verdict. These requests may receive objections from the plaintiff, but they should be made. Engaging with local lawmakers to back bills that introduce limitations on litigation financing along with public education and awareness campaigns have proven to be meaningful in the dialogue surrounding litigation financing. There are several states and some federal districts that are introducing their own limitations on litigation financing ahead of a national discussion that will ultimately lead to additional regulations.
Tort reform has proven beneficial where it has been passed, particularly in Florida (HB 837). The cumulative effects of the reforms include a stabilization of Florida’s insurance market. Now Georgia, through Governor Brian Kemp, has introduced comprehensive tort reform. The tort reform introduced by Gov. Kemp and sponsored by Georgia Sen. John F. Kennedy includes 10 important changes across the two bills.
| • | Anchoring: Limit the ability to make reference to or elicit testimony regarding a specific amount or range of non-economic damages to the jury or prospective jury. |
| • | Filing answers and timing of discovery: Changes the timing of filing answers and respondent pleadings. |

| • | Voluntary dismissal of civil actions: If a case was previously dismissed in a federal or state court action based on or including the same claim, the court can deem the dismissal as an adjudication upon the merits. |
| • | Attorney’s fees and court costs: Prevents recovery of duplicate attorney’s fees, court costs and expenses. |
| • | Recovery of expenses in breach of contract claims: Expenses cannot be claimed as part of damages in a breach of contract case unless the defendant acted in bad faith, has been stubbornly litigious or caused unnecessary trouble and expense. |
| • | Seat belt evidence: Can be introduced and considered in civil actions for determining negligence and apportioning fault. |
| • | Negligent security liability criteria: Limits liability to conditions under the control of the property owner or business. |
| • | Boardable medicals: Limited to those that are reasonable, customary and necessary versus what was billed. |
| • | Bifurcation of liability and damages trial: At the request of either party. |
Georgia had previously introduced and passed needed reforms to their Pre-Answer Settlement statute, commonly known as “Holt Demands,” which have made a big difference in avoiding unfair and unnecessary bad-faith actions against insurers. These changes apply to personal injuries arising from a motor vehicle collision which are welcome reforms though they leave personal injuries arising from non-motor vehicle losses exposed.
Oklahoma is the only other state so far which has announced that tort reform will be a priority for the upcoming 2025 legislative session; however, there have been no published proposals as of January 2025. It is anticipated the reforms would focus on curbing excessive litigation that is driving up the cost of doing business within the state.
Conclusions
Social inflation and disproportionate verdicts continue to drive the increases in claim severities. While litigation rates are holding steady or declining slightly, the average incurred on litigation claims grows at multiples of general inflation. Both the number and magnitude of top tier ($100K +) claims are growing. The average incurred amount for new auto liability bodily injury claims has increased 18.1% since CY 2023. The average new auto liability bodily injury claim attorney cost decreased 22.6%. While the reduction of expenses at first blush may feel good, the increase in average incurred is highly concerning. For the right claims, the defense should be willing to invest in litigation expense if it can be used to gain insight and a competitive advantage in the courtroom. The plaintiffs’ bar has certainly shown a willingness to spend money with focus groups and mock juries to test out their emotional appeals. Gone are the days when an insurer or claims administrator could shrug their shoulders and say, “I know results are bad, but everyone is experiencing the same thing.” Optimizing processes, enhanced legal analytics, use of artificial intelligence and new partnerships are the key to improving outcomes.