 Australia
  Canada
  Denmark
  France
  Germany
  Greece
  Ireland
  Netherlands
  New Zealand
  Norway
  Spain and Portugal
  United Kingdom
  United States
- Winter 2024: CASUALTY
Auto
Report objectives
The objective of this report is two-fold: to provide an overview of our current metrics for our auto liability program and provide an overview of the current environment surrounding auto liability claims and litigation. Designations: auto liability (AU); bodily injury (BI); property damage (PD); and collision (CL).
data parameters
For comparisons, the data is based on both insured and self-insured claims for all states across five calendar years (Jan. 1 through Dec. 31) from 2019 through 2023.
Key observations
For calendar year (CY) 2023, the overall average incurred on new AU claims increased 5%, representing a significant moderation in comparison to the increase seen at mid-year.
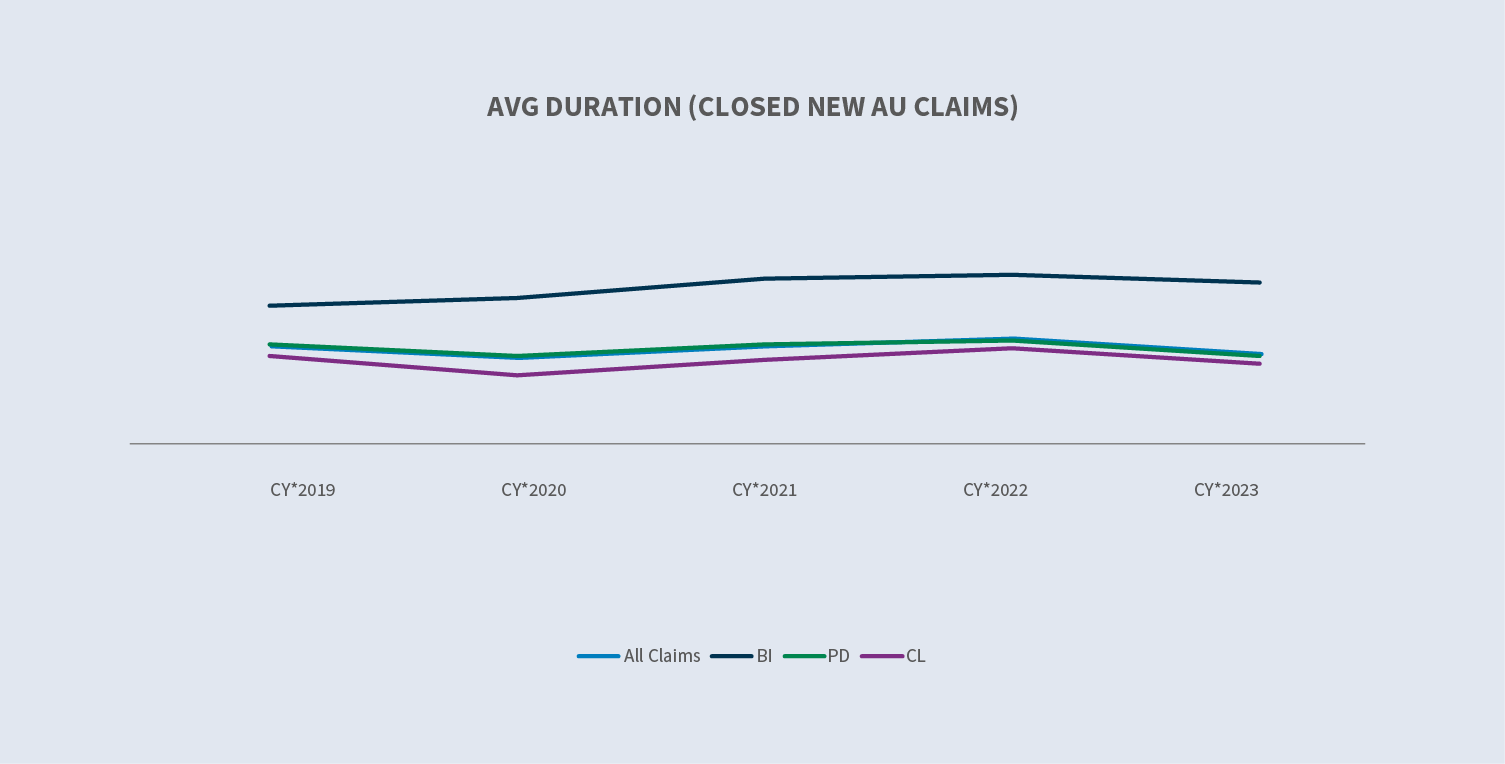
AU new claim durations decreased.
- ∙Open/closed AU BI new claim duration decreased three days year-over-year (YOY).
- ∙Open/closed AU PD new claim duration decreased five days YOY.
Average paid on new auto claims rose 8.2%.
Closure rates on new AU BI claims increased 9%.
The litigation rate for all new AU claims decreased to 0.51% with AU BI decreasing to 3.46%.
The average incurred for new non-litigated AU BI claims increased 11% in CY 2023 compared to CY 2022. The average incurred for new litigated claims increased 13%.
The relative cost of a litigated AU claim (capped at $500K) is over 20 times that of a non-litigated AU claim.
56% of all new auto claims that ultimately become litigated have representation in place at the time of notice and within 24 hours of receipt by Sedgwick — a decrease of 1% in comparison to 2022.
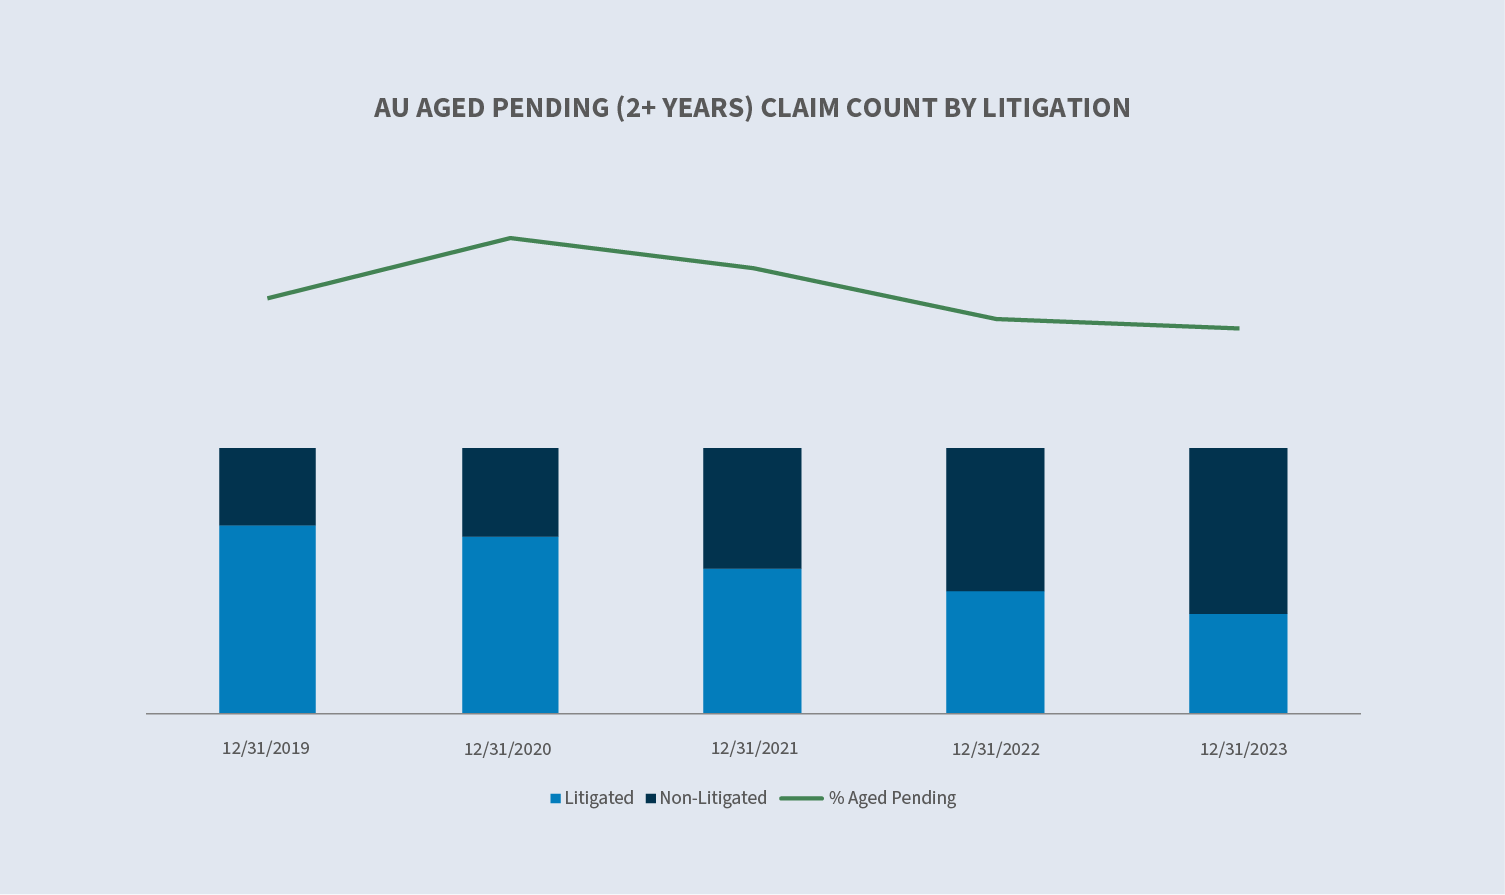
Aged pending decreased to 11.8% in CY 2023. Litigated claims accounted for 38% of the total.
Closed litigated claims increased by 32%, accounting for approximately 3.5% of all closed auto claims and comprising 53% of the total paid.
Market
According to USI Insurance Services, it is projected that commercial auto liability markets will see flat renewals to rate increases of 5% for those with a good loss history and a range of 20% to 30% for more troubled accounts.
Based on a recent study by the Insurance Information Institute, while auto and property insurance markets have shown improvement, the two lines are not expected to see a combined ratio approaching 100% until 2025 ”…and all else being equal, it will take five years of normal premium growth and a decade of normal replacement cost increases for the industry to fully absorb the effects of the last four years of inflation.”
Inflationary trends in auto liability insurance drove loss and defense containment costs between $96 billion and $106 billion higher than they would have been for the period from 2013 to 2023.
Volume
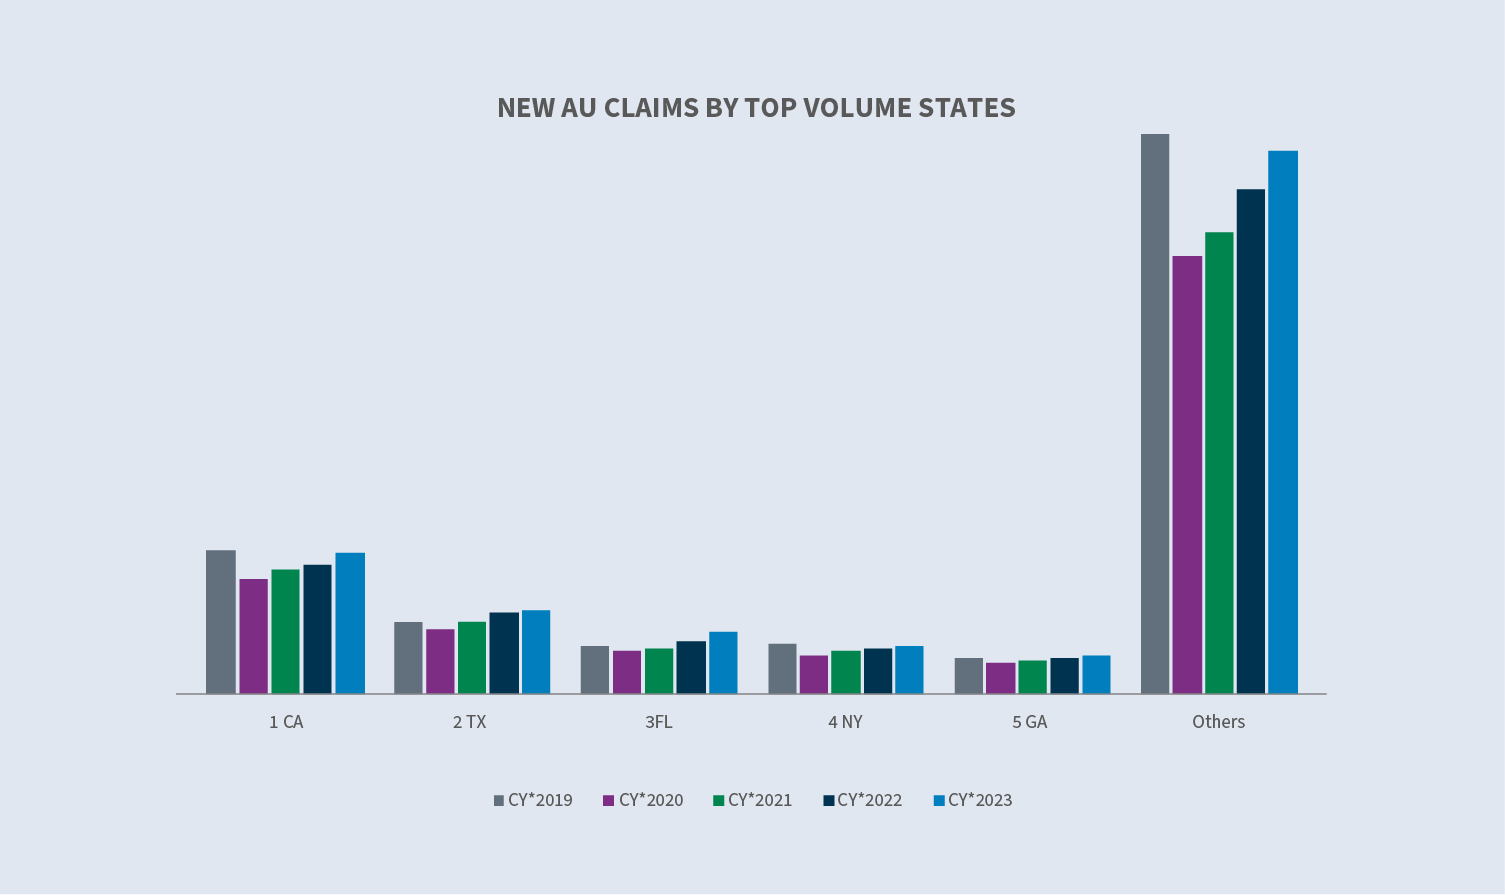
New claim volume increased 7.7% in 2023 following a 9% increase in 2022.

The top five volume states represent 40% of all new auto claims. Florida had the largest increase at 17%.
The top five industries represent 90% of the total claim volume. All groups experienced an increase in new claim volume over 2022, except for carrier which was flat. Transportation, however, remains the chief driver of auto liability claims, representing approximately 34% of the overall new claim volume. Retail increased by 31% in 2023.

The overall BI rate in 2023 for new auto claims increased slightly YOY to 11.7%. Carrier (12.3%), transportation (14.5%), services (10.9%) and food and beverage (7%) all increased, while retail (8.3%) and manufacturing (11.2%) decreased. The BI rate increased in all top volume states.


The average incurred for denied new claims decreased 20% in 2023 compared to 2022, whereas it rose 8% for non-denied (accepted) new claims. The denial rate increased to 14.9% from 12.9%.

Claims durations decreased five days for open/closed claims and decreased four days on closed claims only.

Costs
The average incurred for all new AU claims has been steadily increasing since 2019, up 53.7% over that four-year span. The continuing increase moderated in CY 2023 (+5%) in comparison to CY 2022. The increase is driven by BI claims, which are up 9% in comparison to 2022 and 106.1% since 2019. Although a very small percentage of overall claims, the higher tier incurred groups continue to see an increase in the volume of claims thereby driving the overall incurred value increase.


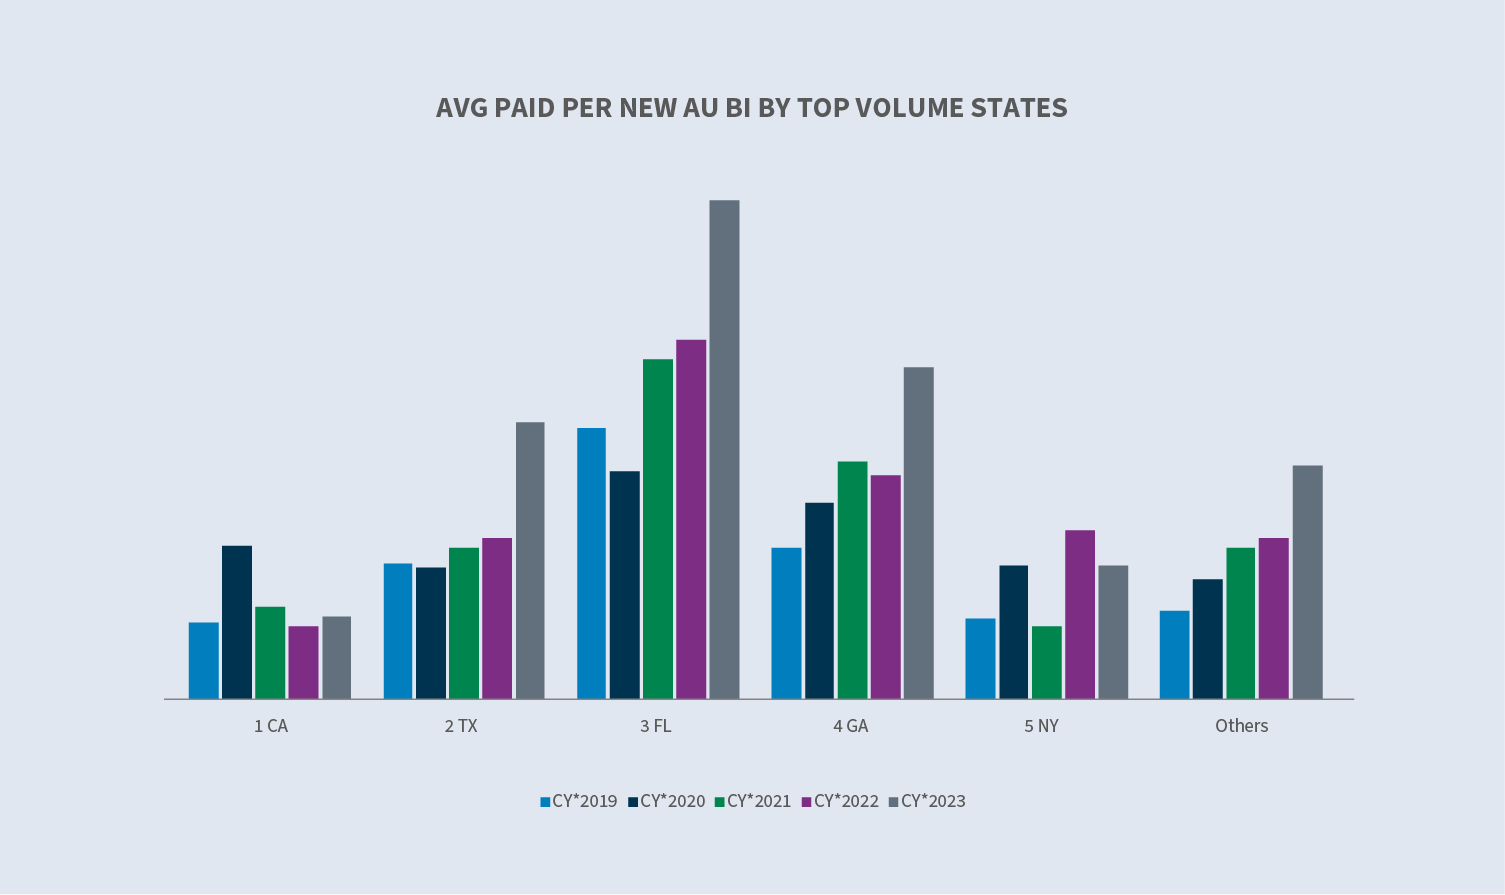
For all new auto claims, average paid increased by 8% (+44% for BI claims) for 2023 in comparison to 2022. Average loss paid is up 7.7% for all claims and up 48% for BI claims.

California (+14.6%), Texas (+71.8%), Florida (+39%), and Georgia (+49.2%) all saw an increase in average paid for new AU BI claims. New York was the only state that saw a decrease (-20.7%).
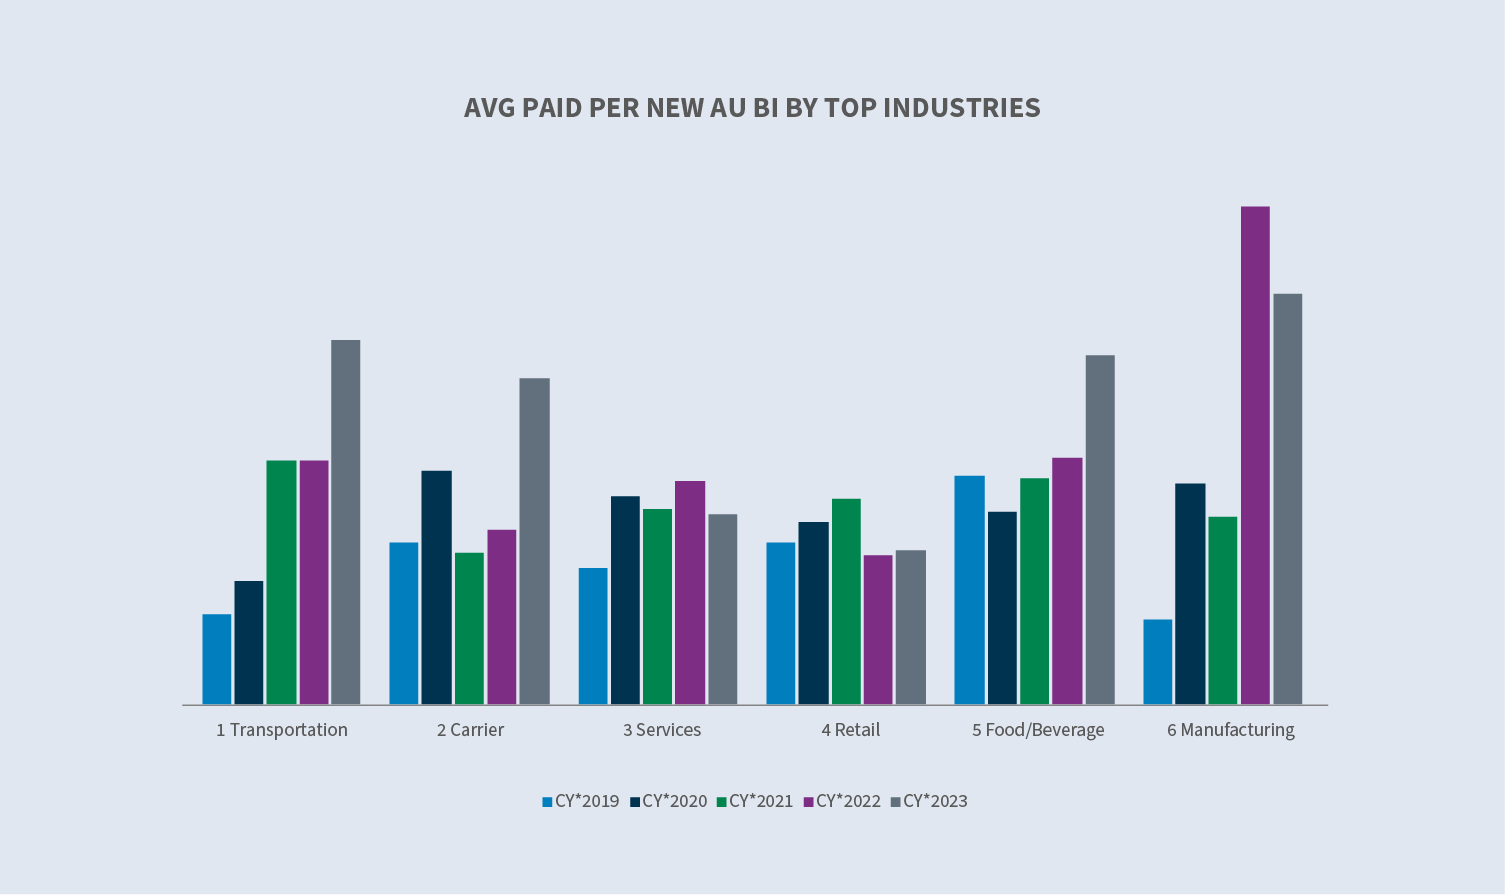
The average paid per new AU BI claim decreased in the service industry (-15.2%) and manufacturing (-17.3%). while increasing in food and beverage (+41%), transportation (+49.5%), carrier (+85.8%) and retail (+2.9%).
Litigation
The overall litigation rate for new AU claims continued a downward trend equaling 0.51% in CY 2023. 57% of the new AU claims that become litigated have representation in place within 24 hours of first notice, and three-fourths of all new AU claims that become litigated have representation in place within 14 days.


The litigation rate decreased in all the top states except for Florida. The Florida increase was driven by lawsuits filed prior to the implementation of tort reform in March. The New York litigation rate dropped below 2% which helped offset the Florida increase. The top industries remained flat or saw a decrease in their litigation rate, except for food and beverage which saw an increase to 0.39% (CY 2023) from 0.31% (CY 2022).
Closed litigated AU claims costs (+26% in 2023 compared to 2022) represented 3.5% of the total auto claims closed and accounted for 53% of the total paid.

Closings
Overall closure of new AU claims increased 7% in 2023 in comparison to 2022, and the percentage of new AU BI claims that closed increased 8.5%.


Aged pending decreased to 11.8% in CY 2023. Non-litigated aged pending increased 2% while litigated aged pending decreased 26% in comparison to CY 2022. Litigated claims account for 38% of aged pending, a significant decrease over the last several years. Florida had the most significant decrease in aged pending, closing CY 2023 at 12.2% in comparison to 14.6% in CY 2022.
Future considerations
Sedgwick trends
Consistent with the overall industry, Sedgwick auto claims data reflects:
- ∙Continued increases in both incurred and paid for new AU claims, although at a moderated rate in comparison to CY 2022.
- ∙Closed litigated AU claims costs continued to increase (+26%) while equaling 3.5% of the total auto claims closed and 53% of the total paid.
- ∙The relative average cost of a closed litigated AU claim remains 30 times that of the average cost of a closed non-litigated AU claim.
- ∙For the upper tier incurred groups ($10K to $25K; $25K to $100K; and $100K and above):
- ·The new claim average incurred decreased. Although constituting a small percentage of the overall claim volume, the percentage of overall claims in each of those tiers increased in comparison to CY 2022.
- ·The closed claim average incurred increased and the percentage of closed claims in those tiers increased in comparison to CY 2022.
Increased claim payment costs continue to be exacerbated by external factors including:
- ∙inflation.
- ∙rising medical costs.
- ∙rising repair costs.
- ∙complexity of repair costs (technology).
- ∙increased closures of litigated claims.

The percentage of claims that are litigated earlier continues to increase, including the number of claims with representation in place before the first notice. However, the overall volume of litigation on new AU clams decreased to its lowest point in three years.
Aged pending (claims open over two years) continues to decrease due primarily to the significant decrease in open litigated claims.
Industry concerns
As driving activity has returned to pre-pandemic levels, claim levels have followed. Although miles driven remain slightly below pre-pandemic levels, severity has increased.
Driving behavior
As noted in our summer 2023 report, since 2019, AU, BI and PD severity has increased by 35% and collision BI severity has increased by approximately 40%.
Driving behavior is deteriorating and is playing a significant role in claim severity. The American Automobile Association reports that:
- ∙The number of drivers who admit to driving over the legal blood alcohol level increased by almost 24%.
- ∙Drivers admitting to driving within an hour of consuming cannabis increased by almost 14%.
- ∙More than a quarter of drivers (27%) reported having sent a text while driving and 38% reported reading a text while driving.
- ∙Fewer drivers perceive speeding as dangerous.
Increased claim costs
According to AM Best, claim trends in general rose for auto claims – the average claim increased 11% and the average defense and cost containment expense increased 29% from 2021 to 2022, a trend that was expected to continue through 2023.
CCC in their Year in Review Report, identified three auto industry trends that defined 2023: escalating U.S. vehicle theft rates; Impact of strikes on the supply chain for vehicles and parts; and Vehicle repair costs at +5% following double digit increases in 2021 (+10%) and 2022 (+12%).
According to the Insurance Information Institute, although frequency for auto accidents flattened in 2022, severity rose more than frequency declined, leading to higher losses overall. Increasing inflation (economic and social) increased losses from 2013 to 2022 by 19% to 24%.
According to the Enlyte Trends Report, ADAS calibration frequency for repairable vehicles was at 17% in 2023. It expected to reach 40% by the end of 2024 and 60% by the end of 2025 as the average model year of repairable vehicles approaches 2018 which was the year at least one ADAS feature was included in all new vehicles.
Litigation
The cost of auto liability litigation continued to increase in CY 2023. Four primary areas of concern:
Litigation funding is the process of investors providing capital to plaintiff’s attorneys which allows them to leverage a portion of the future asset of a lawsuit and acquire immediate capital. One recent study estimated that large US commercial litigation funders had a total of $13.5B in assets under management as of 2022. Concerns with litigation funding include increasing the duration of litigated matters, plaintiffs being less inclined to seek resolution in hopes of securing an extreme verdict, and the outsized influence of those not necessary to the litigation process. States are beginning to expand regulation of third-party litigation funding through regulatory and or the legislative process. Only four courts require disclosure of third-party litigation finance: New Jersey and Delaware U.S. District courts and Wisconsin and West Virginia state courts. In September 2023, the US District Judge (Florida) in the 3M multidistrict litigation (earplugs) issued an order specifically prohibiting litigation funding in the matter. This was an extraordinary action yet exemplifies the concerns that litigation funding has on the process.
Social inflation refers to the impact of rising litigation costs on claim payouts, loss ratios, and, ultimately, how much policyholders pay for coverage. Research suggests that social inflation could be causing losses to increase 2% to 3% each year over and above general inflation. Multiple factors are contributing to social inflation within the liability market, including attorney advertising, tort reform deterioration, desensitization to large jury awards and declination of attitudes toward corporations. Juries continue to dictate that when someone is injured, someone else must pay — and that “someone” is inevitably the party perceived to have deep pockets.
Plaintiff bar tactics and novel theories of liability are continuing to drive up claim values. Tactics include jury anchoring, reptile theory and novel theories such as expansion of vicarious liability.
- ∙Jury anchoring: A strategy used to cause jurors to use a specific, often random, point of reference when evaluating damages in a lawsuit. Typically, it includes making references to corporate revenue or income as a means to set a start point for damages.
- ∙Reptile theory: This strategy continues to inflame jury awards nearly 15 years after it’s emergence and requires additional defense planning and preparation driving up litigation costs as well as claim payouts.
- ∙Novel theories of liability for auto claims include expansion of vicarious liability. These novel theories are not getting overturned by appellate courts and require additional legal strategies to overcome.
Nuclear verdicts: Large jury verdicts are continuing to drive up values attributed to liability claims. A recent study by Marathon Strategies found:
- ∙Nuclear verdict amounts increased by 178% compared to the five years prior to the COVID-19 pandemic.
- ∙Court closures interrupted the trend in 2020.
- ∙The sum of nuclear verdicts nearly quadrupled in the two years following 2020, increasing from $4.9 billion to over $18.3 billion in 2022.
- ∙In 2022, the number of nuclear verdicts doubled with the median amount increasing from $21.5 million to $41.1 million.
- ∙There were 20 awards over $100 million and four over $1 billion in 2022.
Litigation avoidance at the claim stage must continue to be a focus, particularly when recognizing the trend of claims being litigated sooner. Advocacy and timely communication that promotes understanding of the claim process with a resolution focus will help ensure that claims do not become litigated. Additionally, utilization of predictive modeling identifying claims likely to become litigated can prompt an aggressive workflow to push appropriate and timely resolution.

Once a suit is at hand, seek to reach an amicable pretrial settlement. Identifying counsel with the specific knowledge and expertise of the relevant area of law, the jurisdiction and of current plaintiff strategies is foundational to favorable outcomes. Resolve all appropriate cases expediently. Alternative dispute resolution mechanisms generally present fewer volatile forums to reach settlements, and bench trials more often are preferable to jury trials.
If a trial is warranted or unavoidable, specific trial tactics must be undertaken. Ensuring the defense attorney has a defined litigation strategy that encompasses an approach to the known challenges — reptile theory, anchoring, corporate sentiments, etc. — is a must. A different narrative must be created to ensure the best possible outcome.