 Australia
  Canada
  Denmark
  France
  Germany
  Greece
  Ireland
  Netherlands
  New Zealand
  Norway
  Spain and Portugal
  United Kingdom
  United States
- Winter 2024: CASUALTY
General liability
Report objectives
The objective of this report is two-fold: to provide an overview of our current metrics for our general liability program and to provide an overview of the current environment surrounding general liability claims and litigation.
data parameters
For comparisons, the data is based on both insured and self-insured claims for all states across five calendar years (Jan. 1 through Dec. 31) from 2019 through 2023.
Key observations
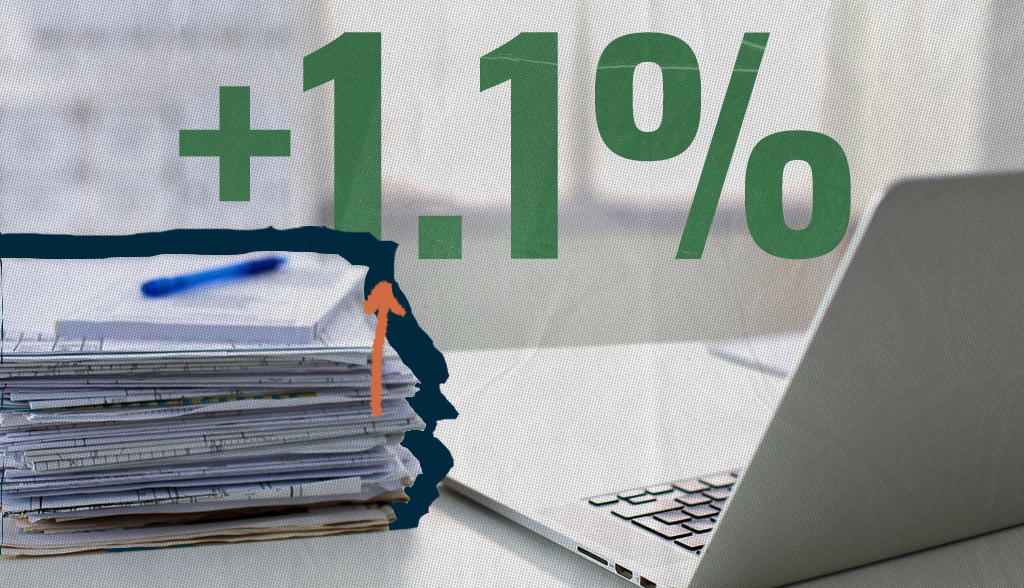
2023 general liability new claim volume increased 1.1% from 2022.
Total incurred on new claims increased 13.9%.
- ∙Total incurred increased 37% in the past 24 months.
- ∙GL claims with $0 incurred decreased 1.3% from 2022 (51.8% of claims) to 2023 (50.5% of claims).
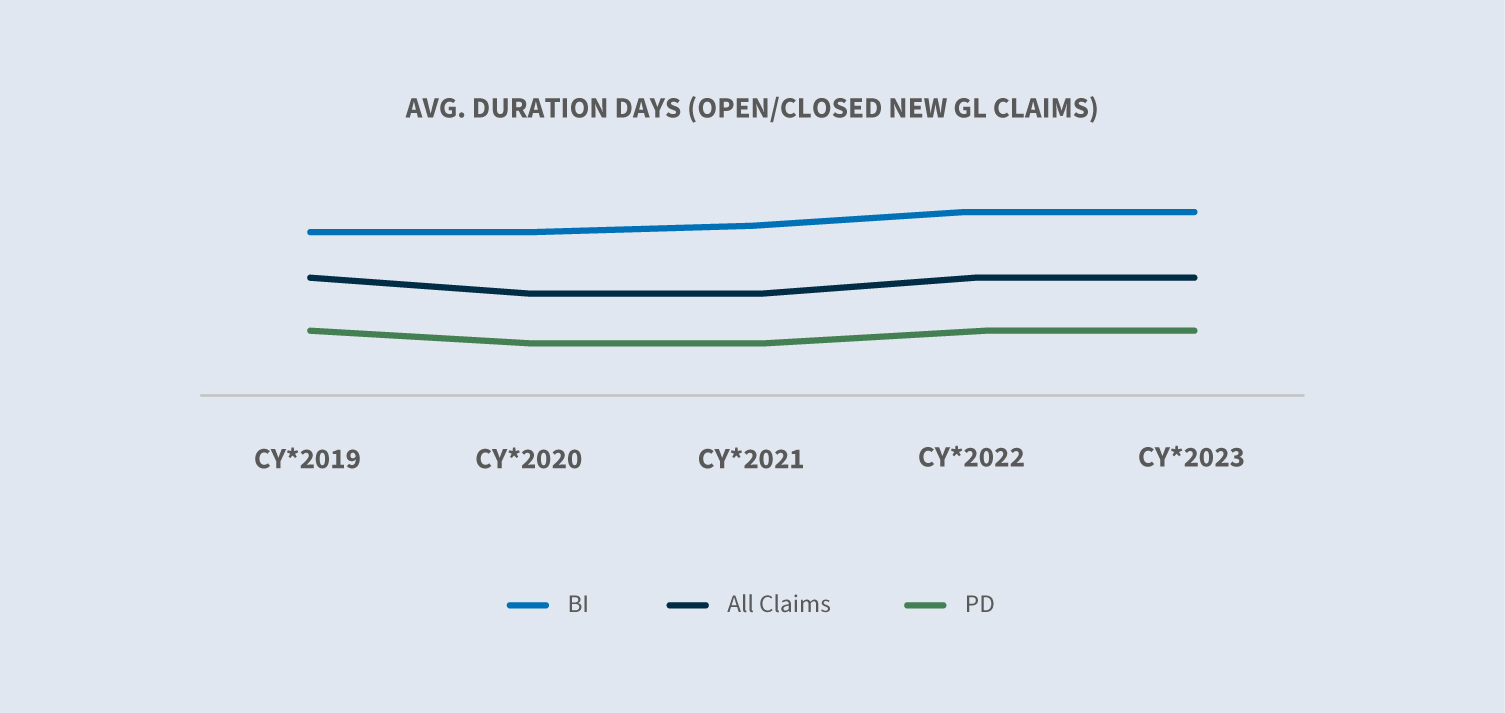
Average claims duration remained flat.
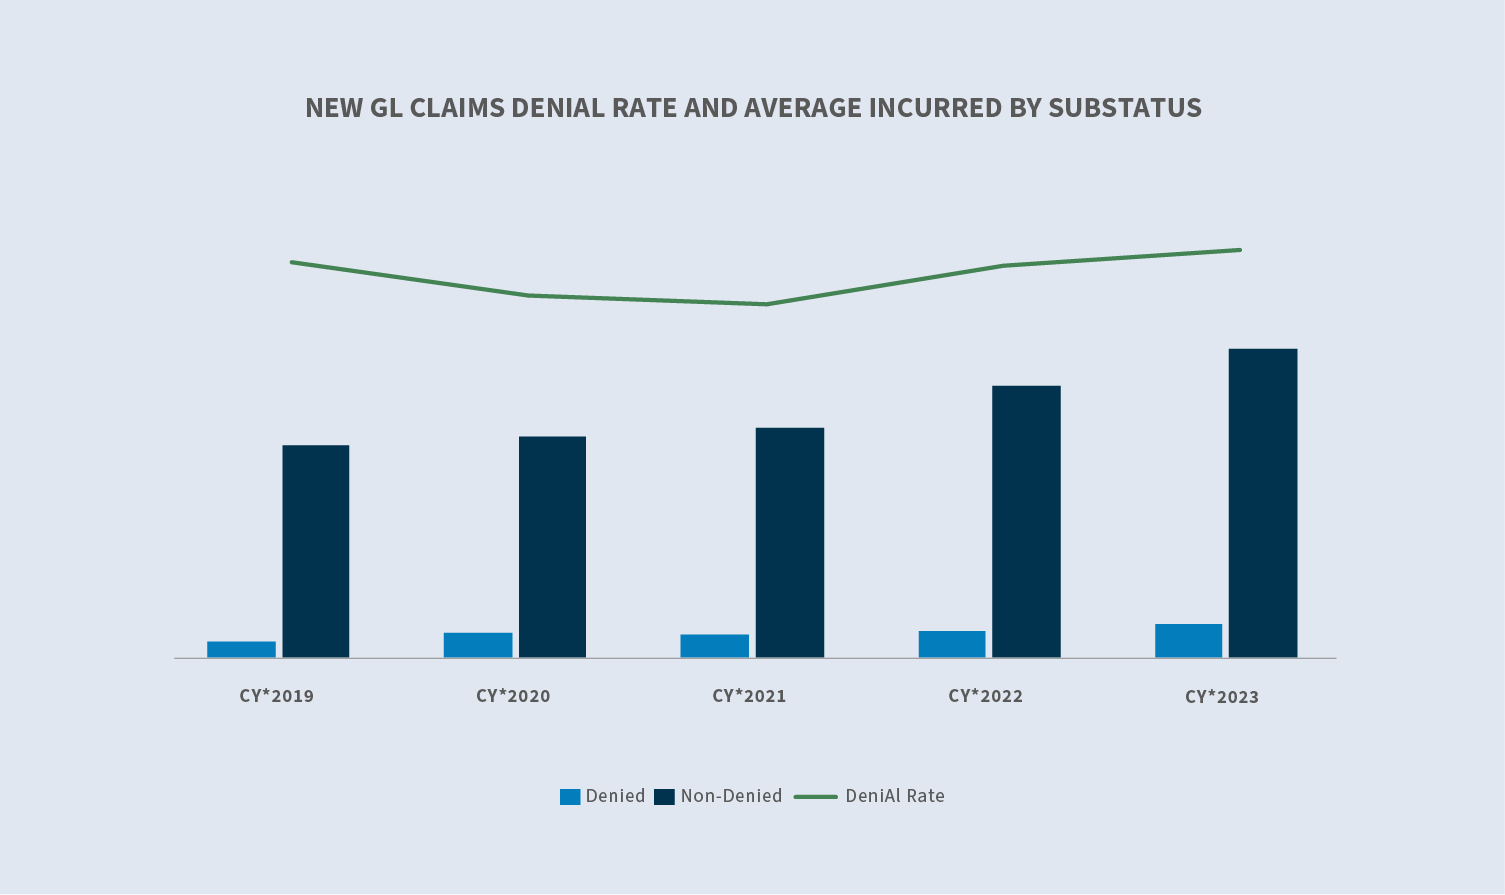
The denial rate on new claims increased to 23.4%.
- ∙Average incurred for denied claims increased 27.1% over 2022.
- ∙Average incurred for accepted claims increased 13.5% over 2022.

The closure rate for all new GL claims was flat in comparison to 2022.
In CY 2023, total claims closed increased by 5%.
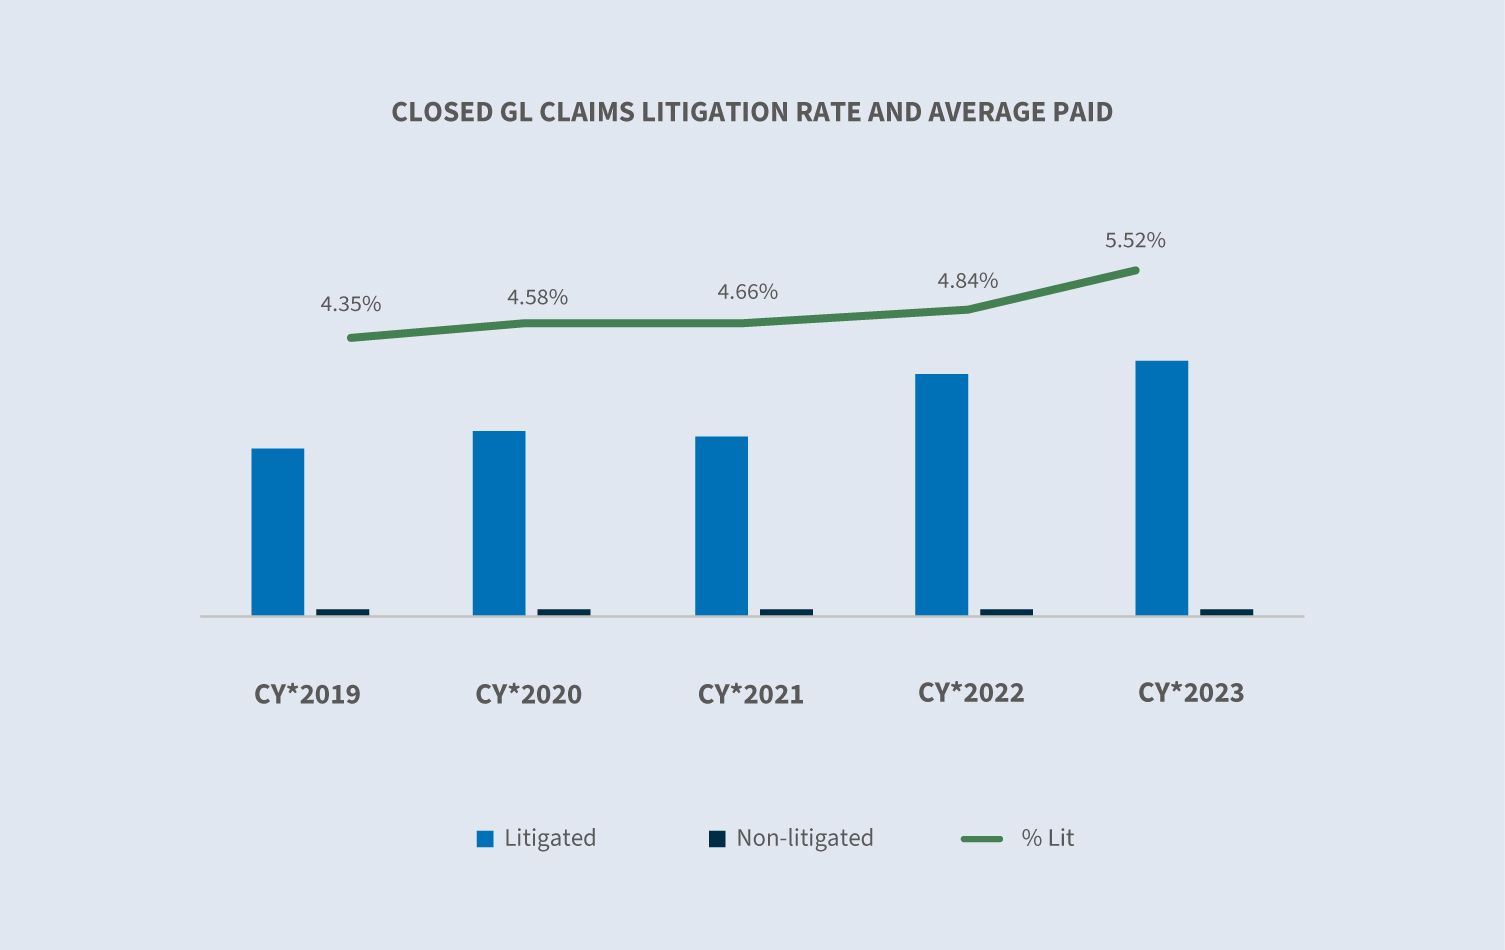
- ∙5.5% of the claims closed were litigated.
- ∙The overall closure volume for litigated claims increased 19% over 2022.
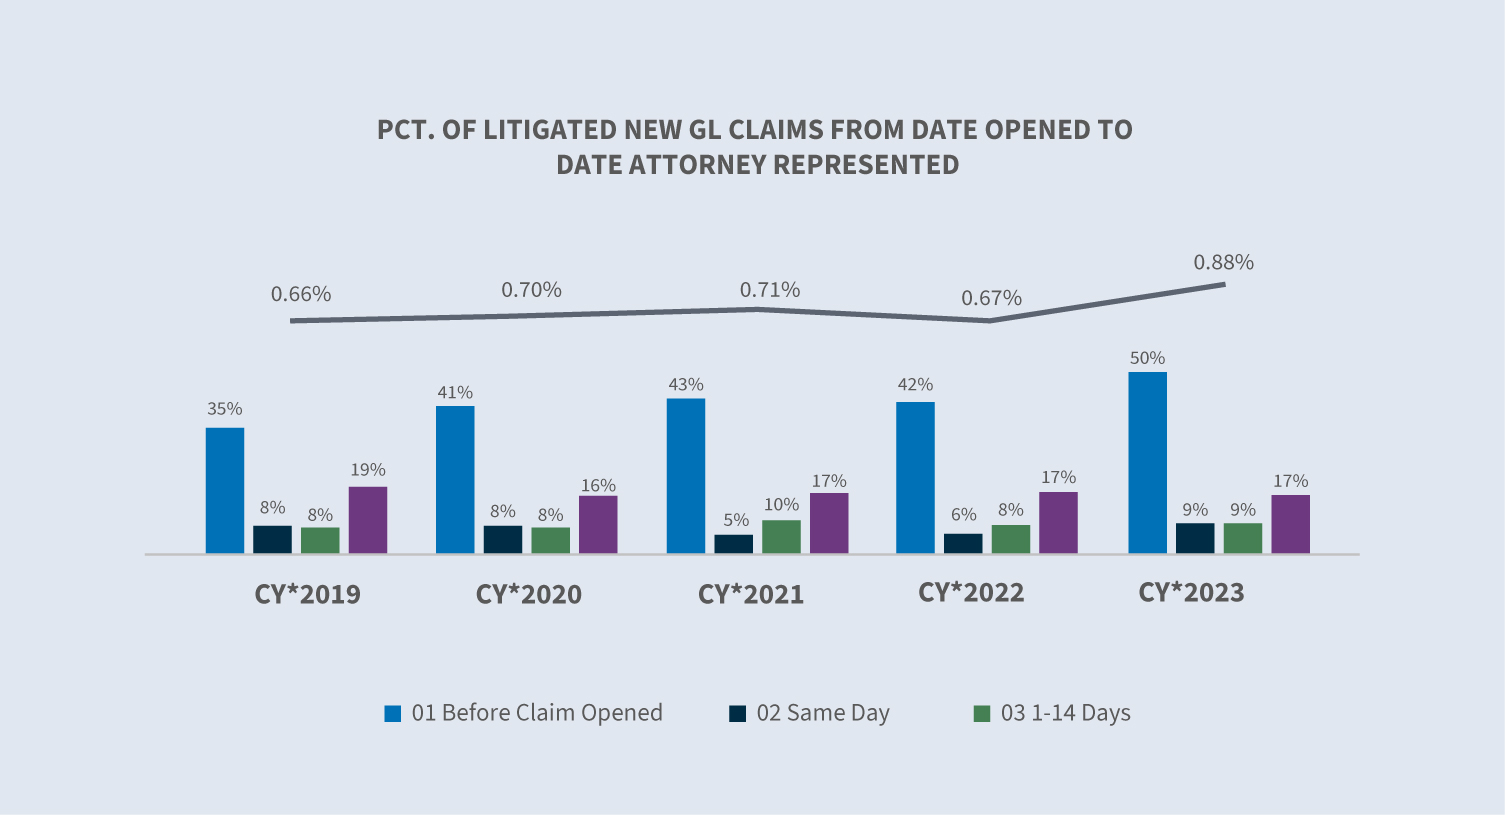
Currently, 58% of all new GL cases that become litigated have representation in place within 24 hours of notice and two-thirds have representation in place within the first two weeks.
Average paid increased 16.7% in 2023 over 2022. The average loss paid increased 20%, while the average expense paid was flat.
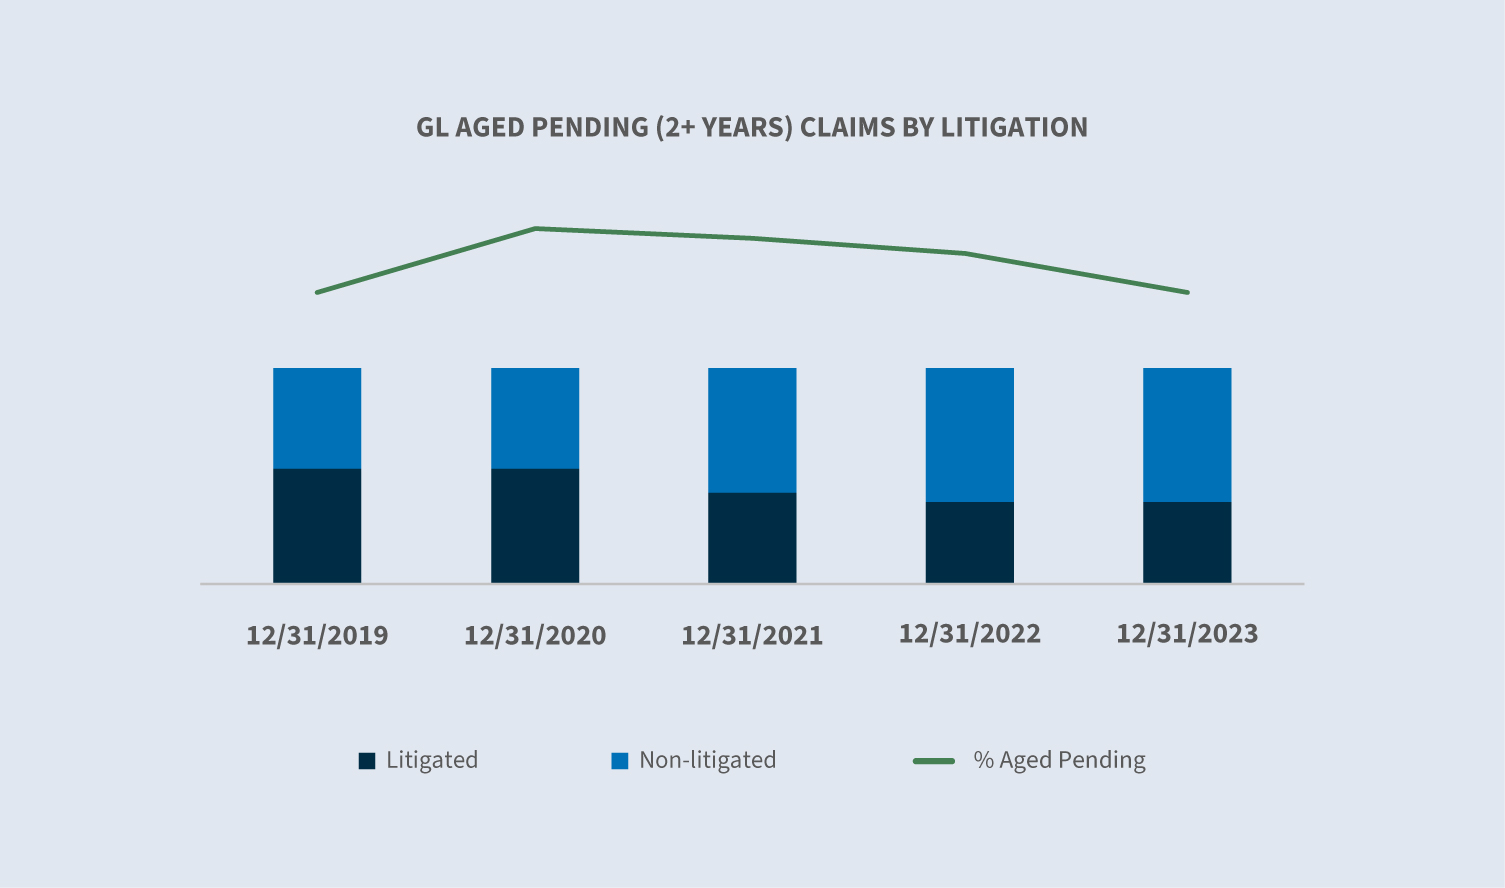
Aged pending (two years or more) decreased 2.5%.
- ∙The ratio of litigated aged pending to non-litigated decreased year-over-year (YOY).
- ∙38% of all aged pending claims are litigated claims.
Market
According to a Swiss Re Institute report issued September 2023, U.S. liability claims costs rose 16% on average for the last five years, far exceeding economic claims drivers.
U.S. consumer prices rose 3.4% annually to close out 2023. Core CPI measured 3.9% annually for 2023.
In its Q4 2023 Outlook, the Insurance Information Institute forecast P/C growth of 2.1% in 2023. They also noted that P/C underlying growth should continue to improve over the next three years, potentially outperforming the wider economy by 2025.
The S&P Global Market Intelligence 2023 U.S. P&C Insurance Market Report calls for a combined ratio of 100.8%; other sources project a combined ratio of 103.4%.
In its November report, Milliman noted a 2023 net combined ratio forecast of 96.9 for general liability, which falls between 2021 and 2022 actual results.
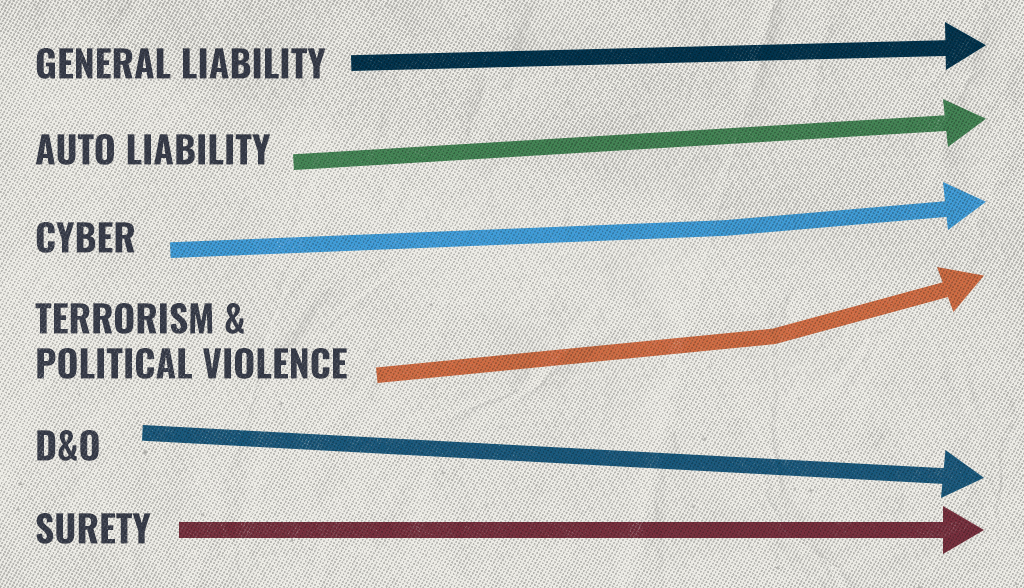
Continued rate increases can generally be expected according to S&P Global, Swiss Re and Business Insurance News.
- ∙General liability rate increases are projected to be between flat and 5%.
- ∙Auto liability is predicted to increase by 5% to 10%.
- ∙Cyber increases have slowed with anticipated increases between flat and 10%.
- ∙Terrorism and political violence coverages are speculated to increase between 15% and 40%.
- ∙D&O is projected to decrease by 10% to 15%.
- ∙Surety is predicted to remain flat.
Volume
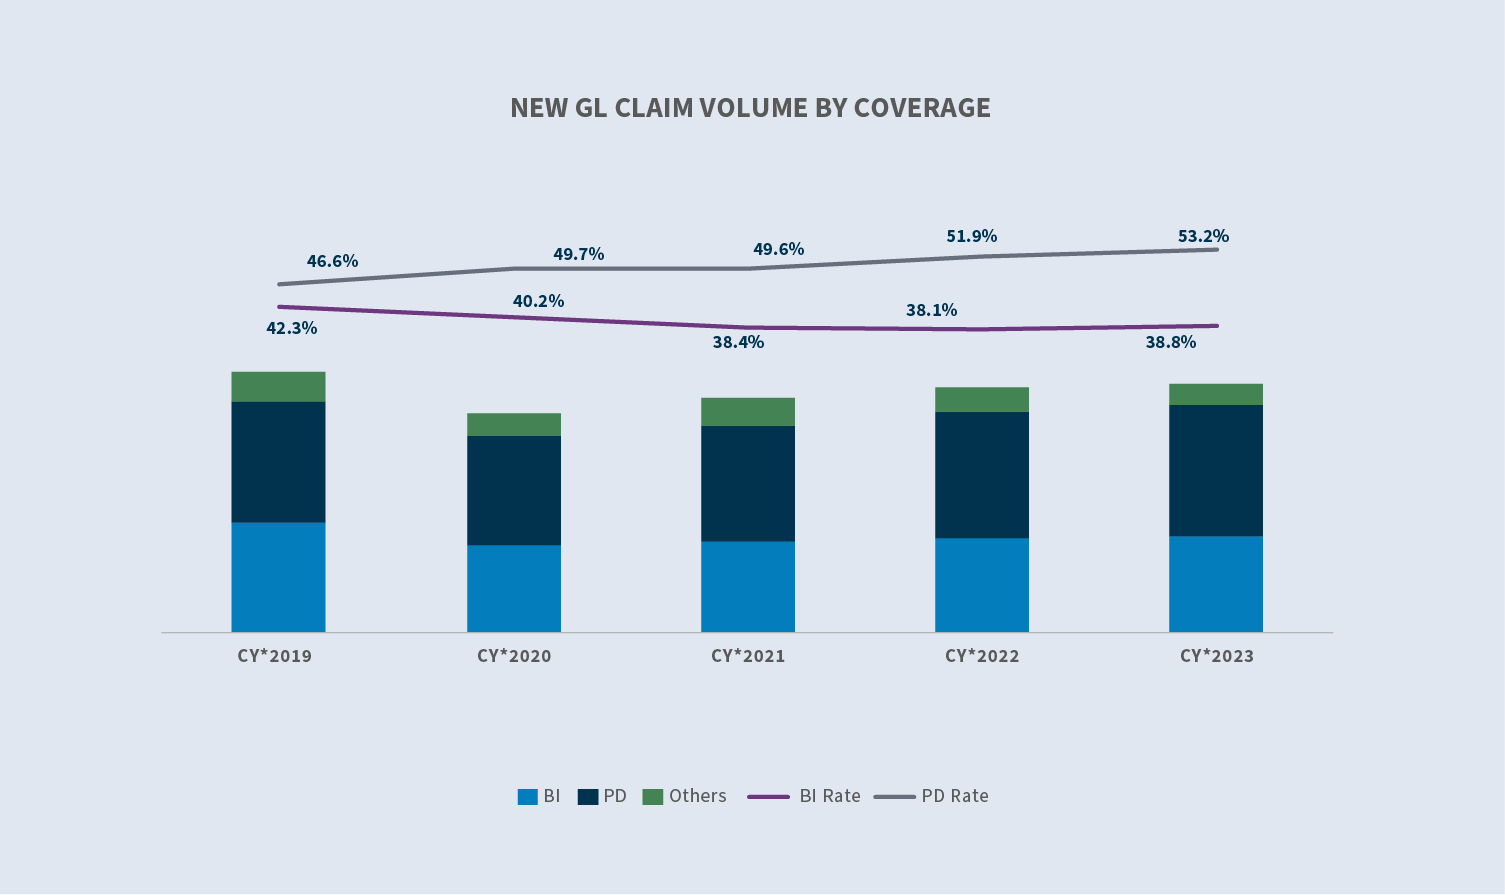
GL claim volume increased 1.1% overall in calendar year (CY) 2023.
- ∙GL BI claim volume +3%
- ∙PD claim volume +3.7%
- ∙Other claim volume (-20%)
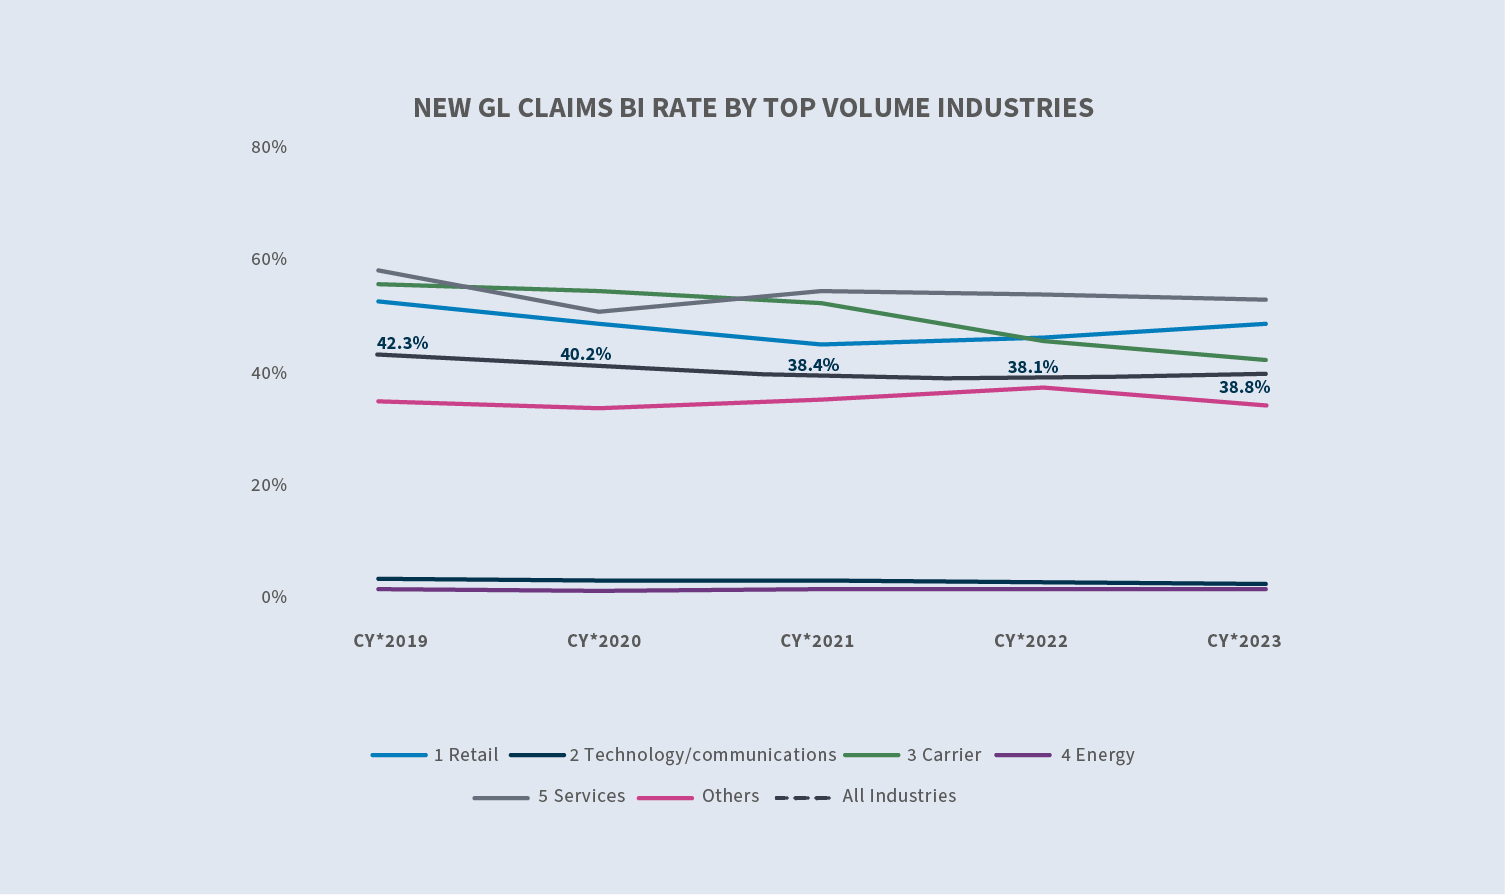
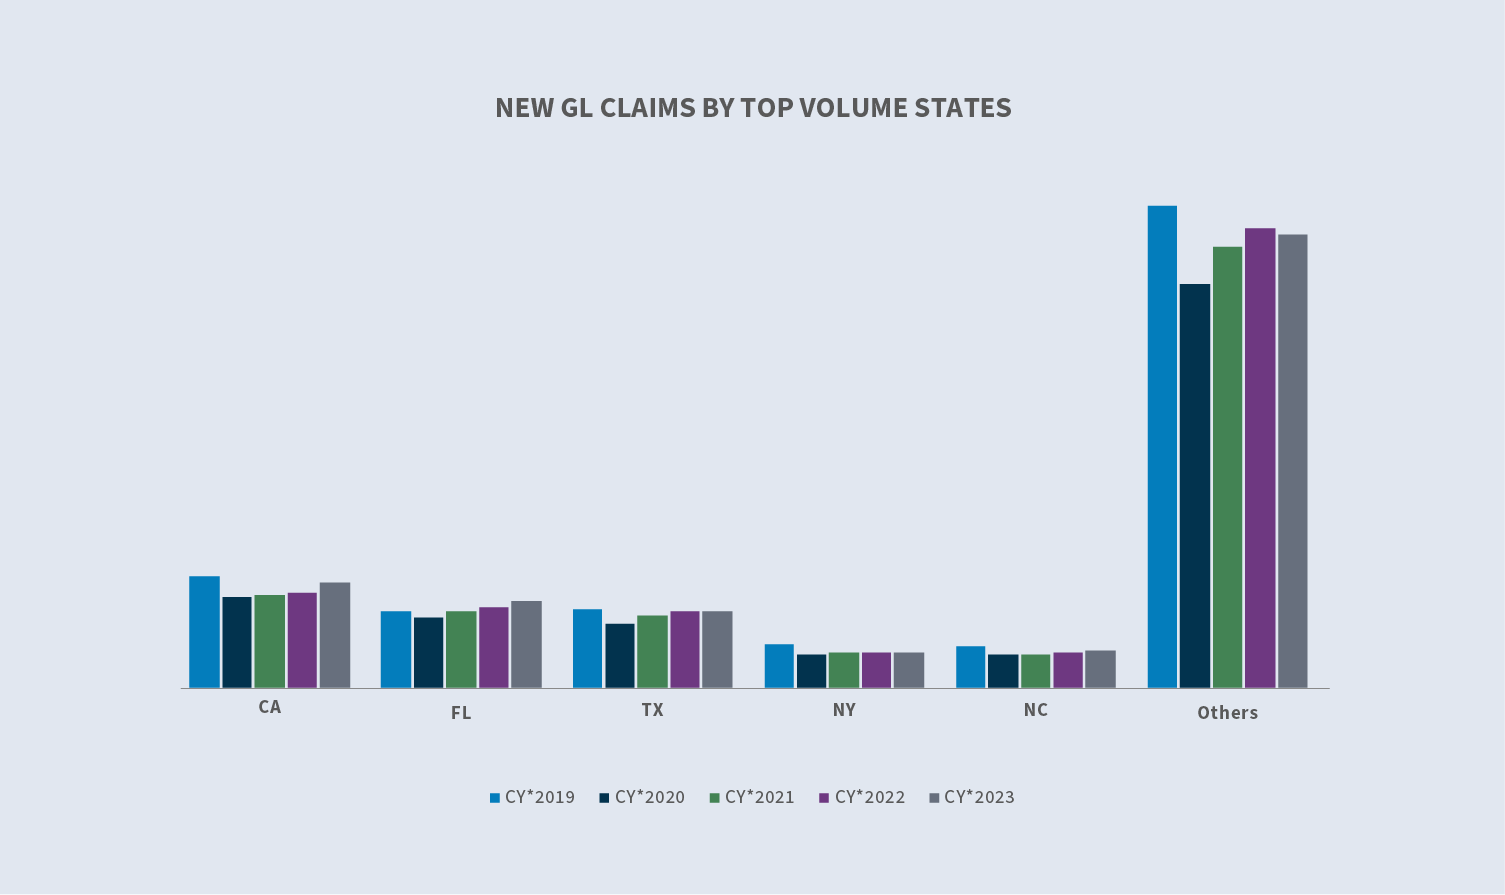
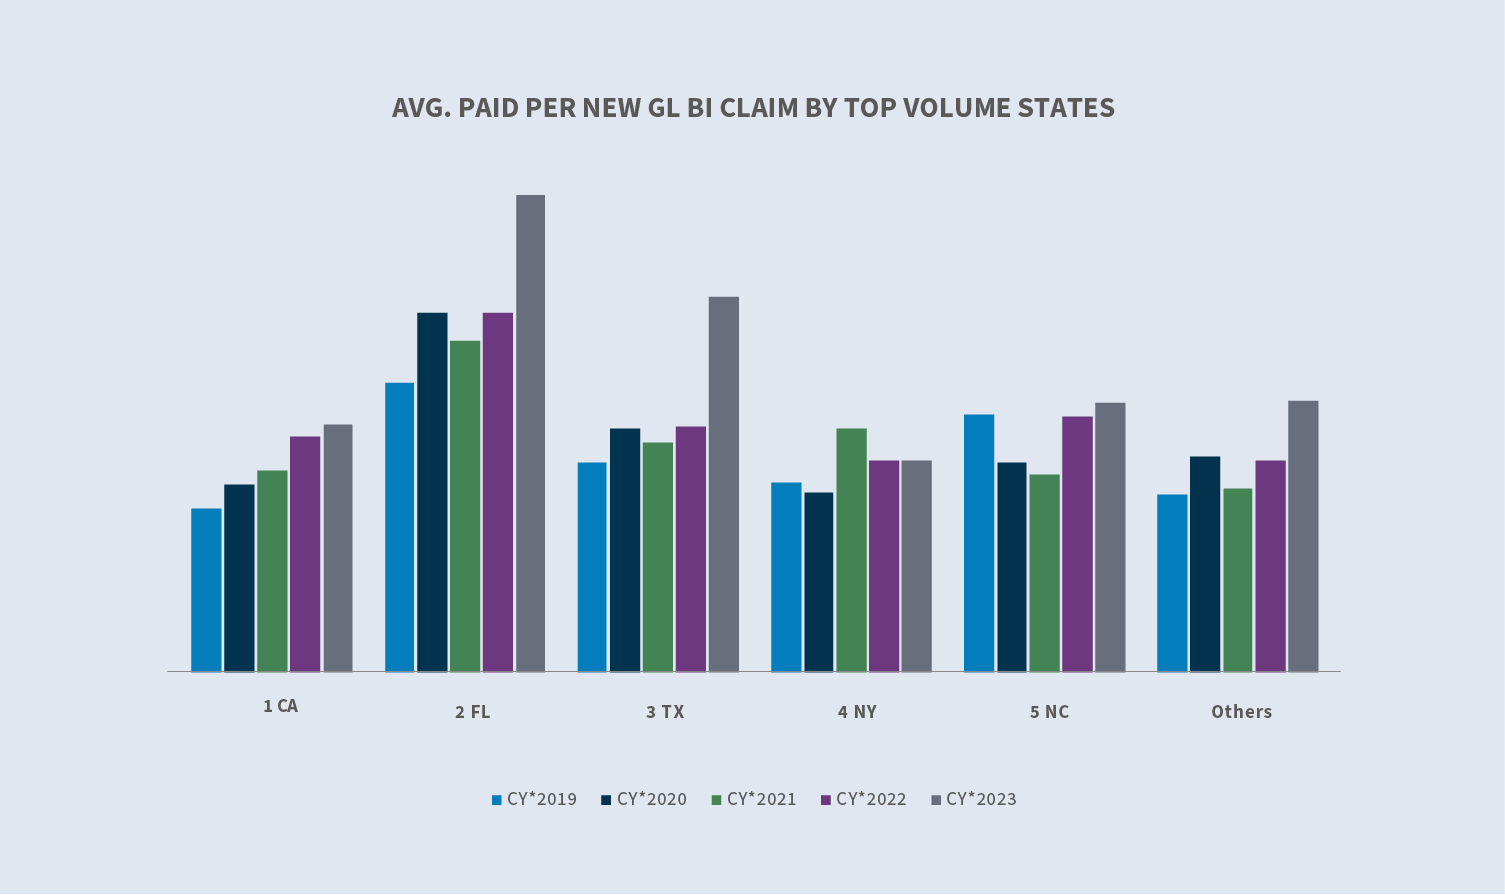
The five states generating the highest number(s) of new general liability claims are: California, Florida, Texas, New York and North Carolina. Combined, they account for 43% of the general liability new claim volume. From CY 2022 to CY 2023, California, Florida and North Carolina claim counts increased and claim counts for Texas and New York decreased.
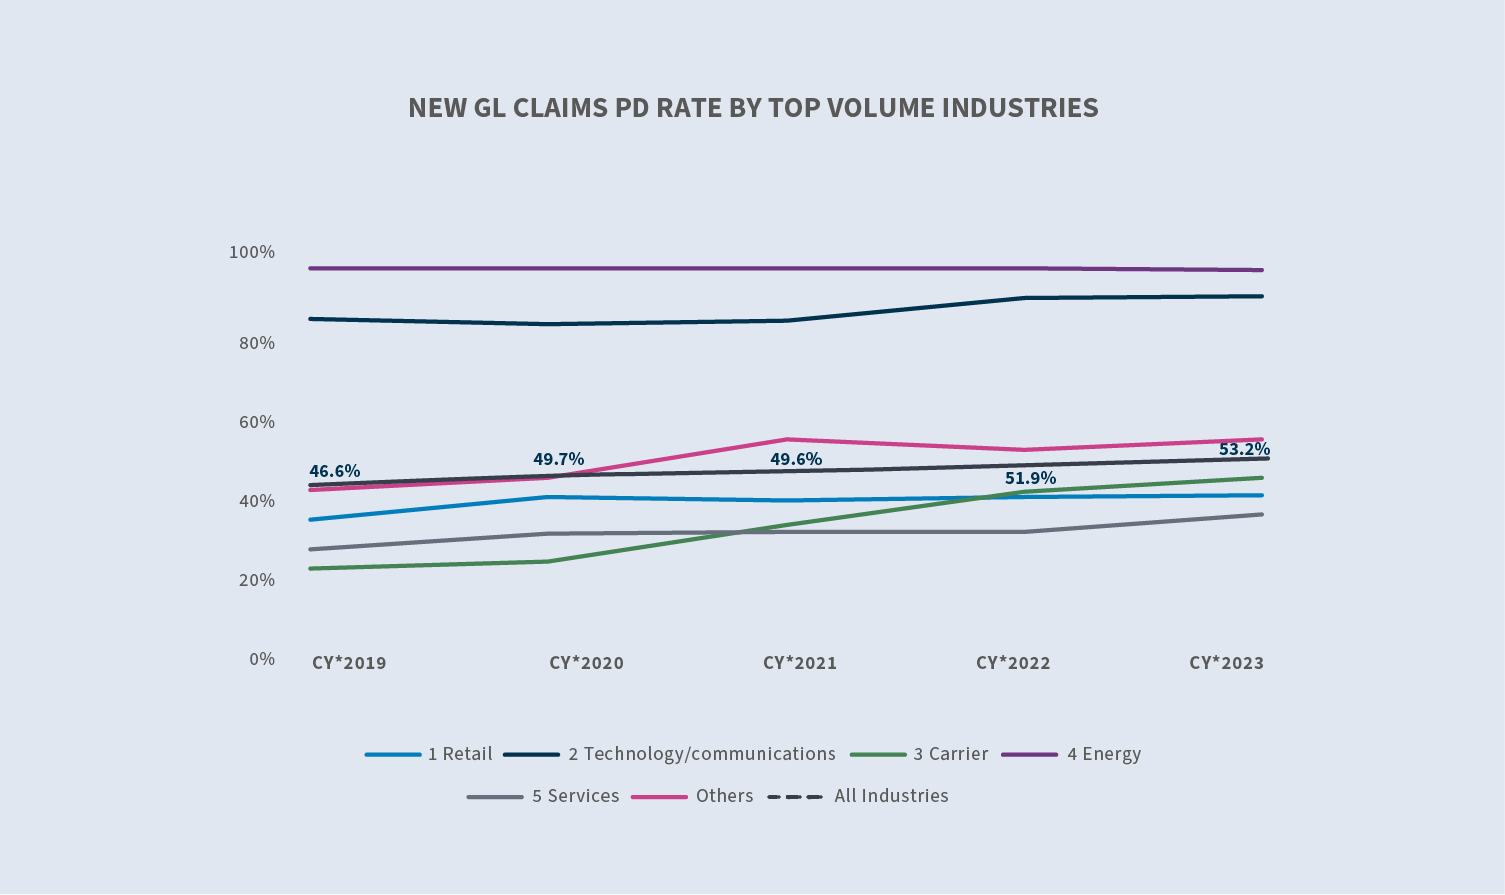
After decreasing steadily from 2019 through 2021, denial rates began to increase in 2022 and increased further in 2023 to 23.4%. The average incurred on new denied claims increased 27.1% in CY 20223 compared to CY 2022. The average incurred on new non-denied (accepted) claims increased 13.5% in CY 2023 compared to 2022.
Costs
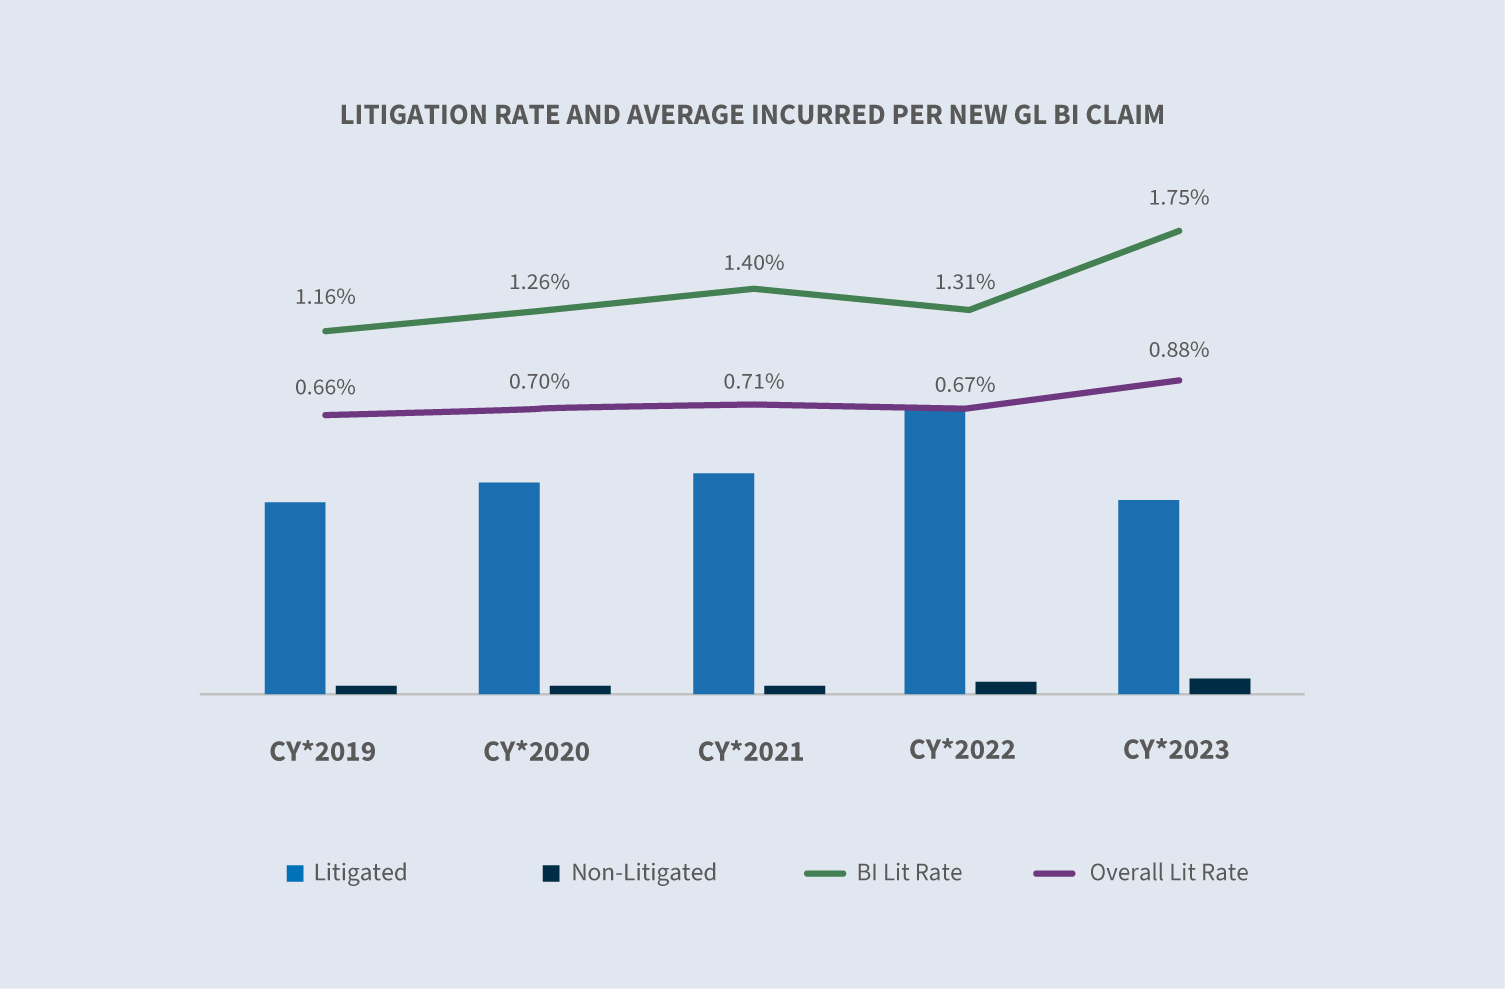
Average paid for new claims has continued to increase overall across all new GL claims over the past five years. The average paid across all new claims increased by 16.7% in CY 2023, and the average cost per new BI claim increased 25.9%. Florida and Texas are the top Sedgwick states for increase in average costs compared to 2022, as well as highest average dollar amount paid out on new BI claims.
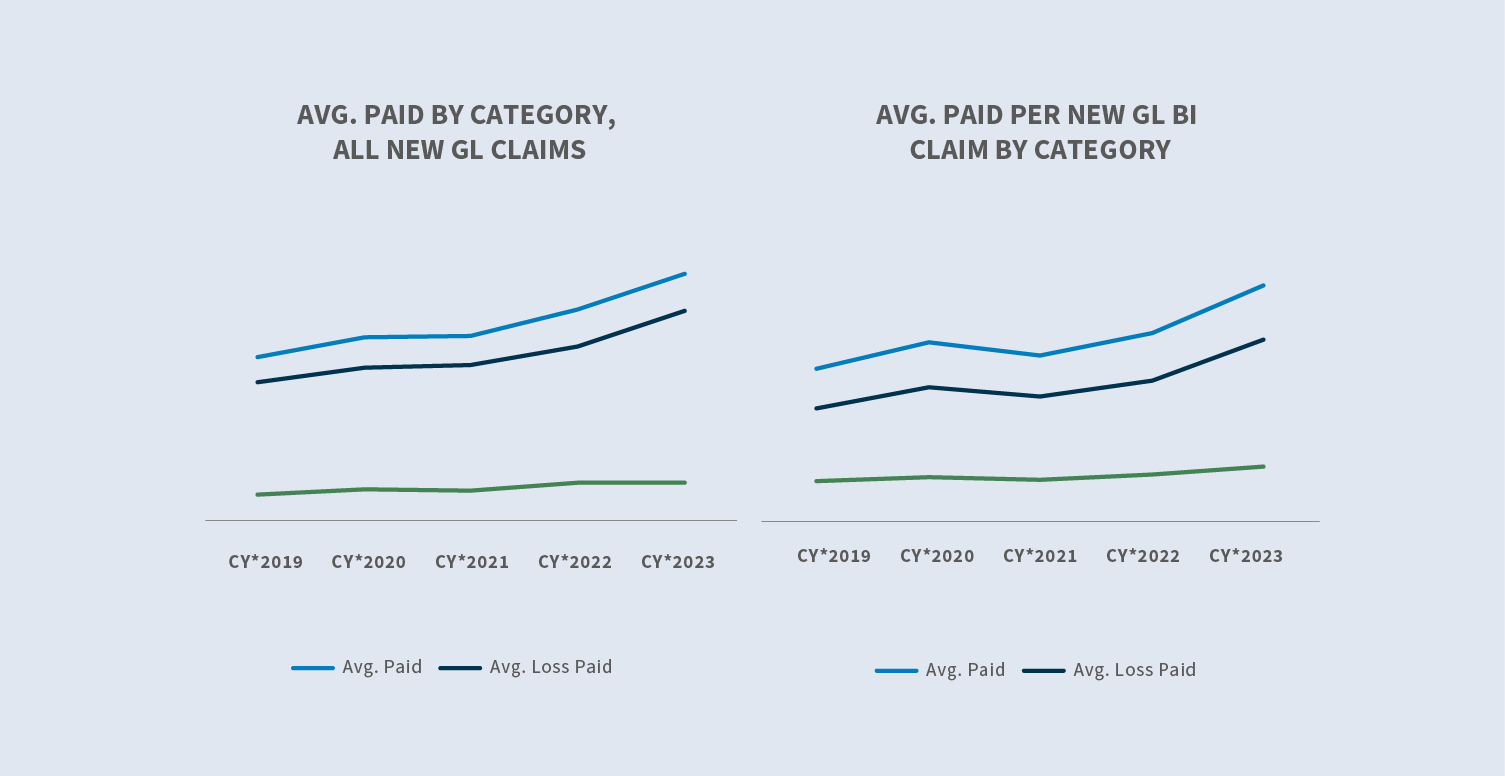
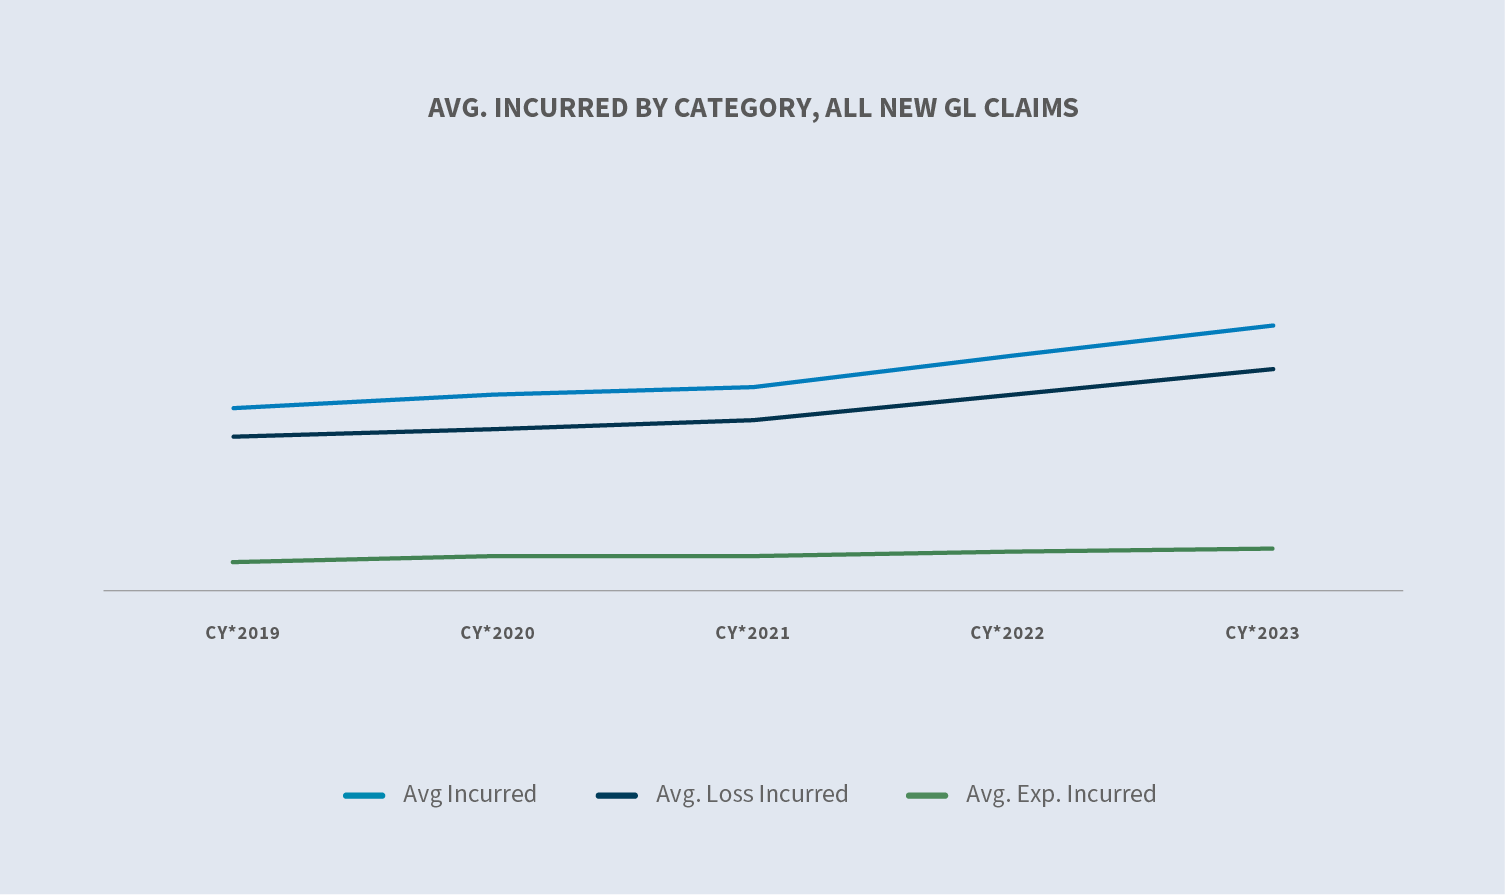
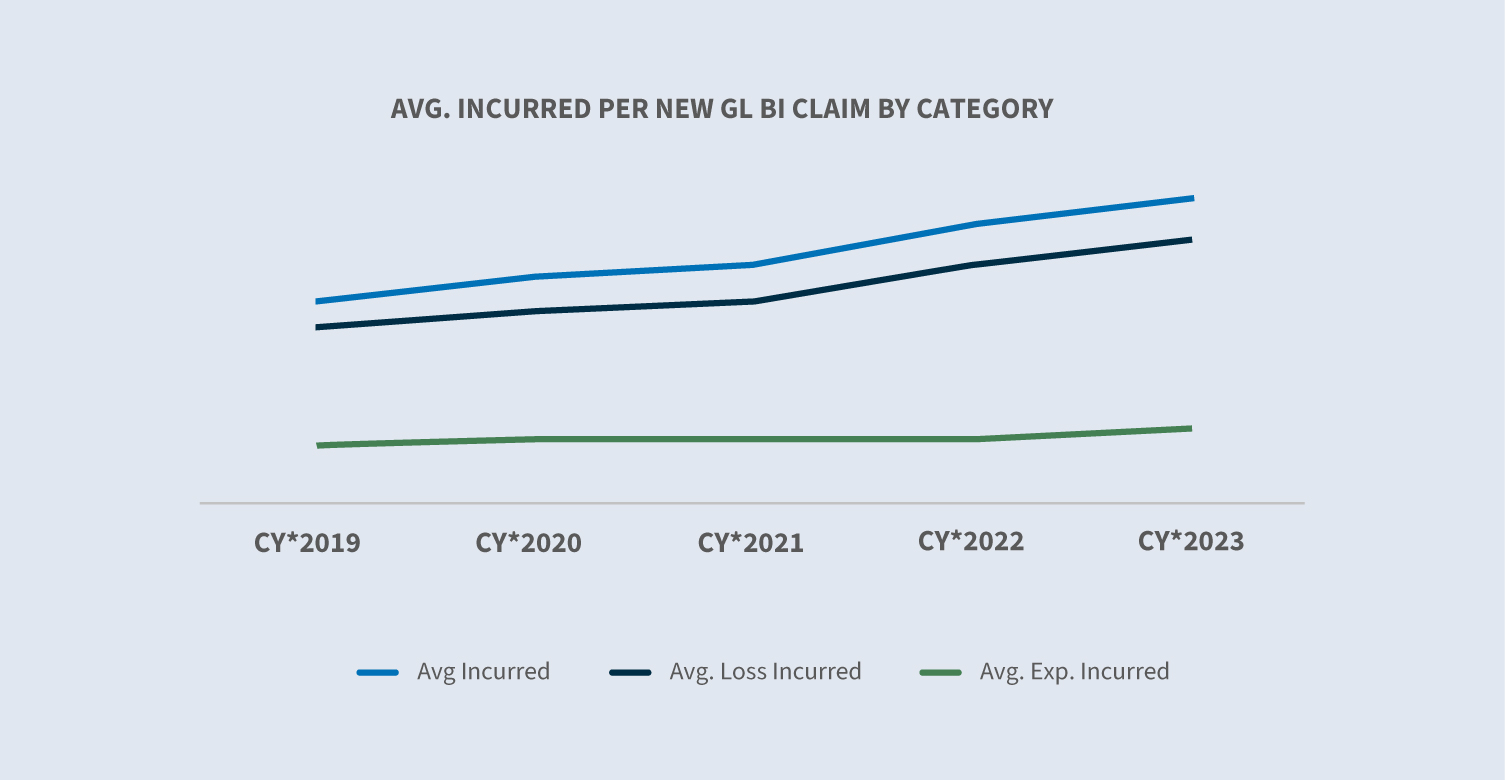
The average incurred loss for all new GL claims increased by 12.7% in CY 2023 compared to CY 2022. The average incurred for new GL BI claims increased 11.4% compared to CY 2022. Growth in the average loss incurred continues at a greater rate than average expenses and continues to outpace inflation.
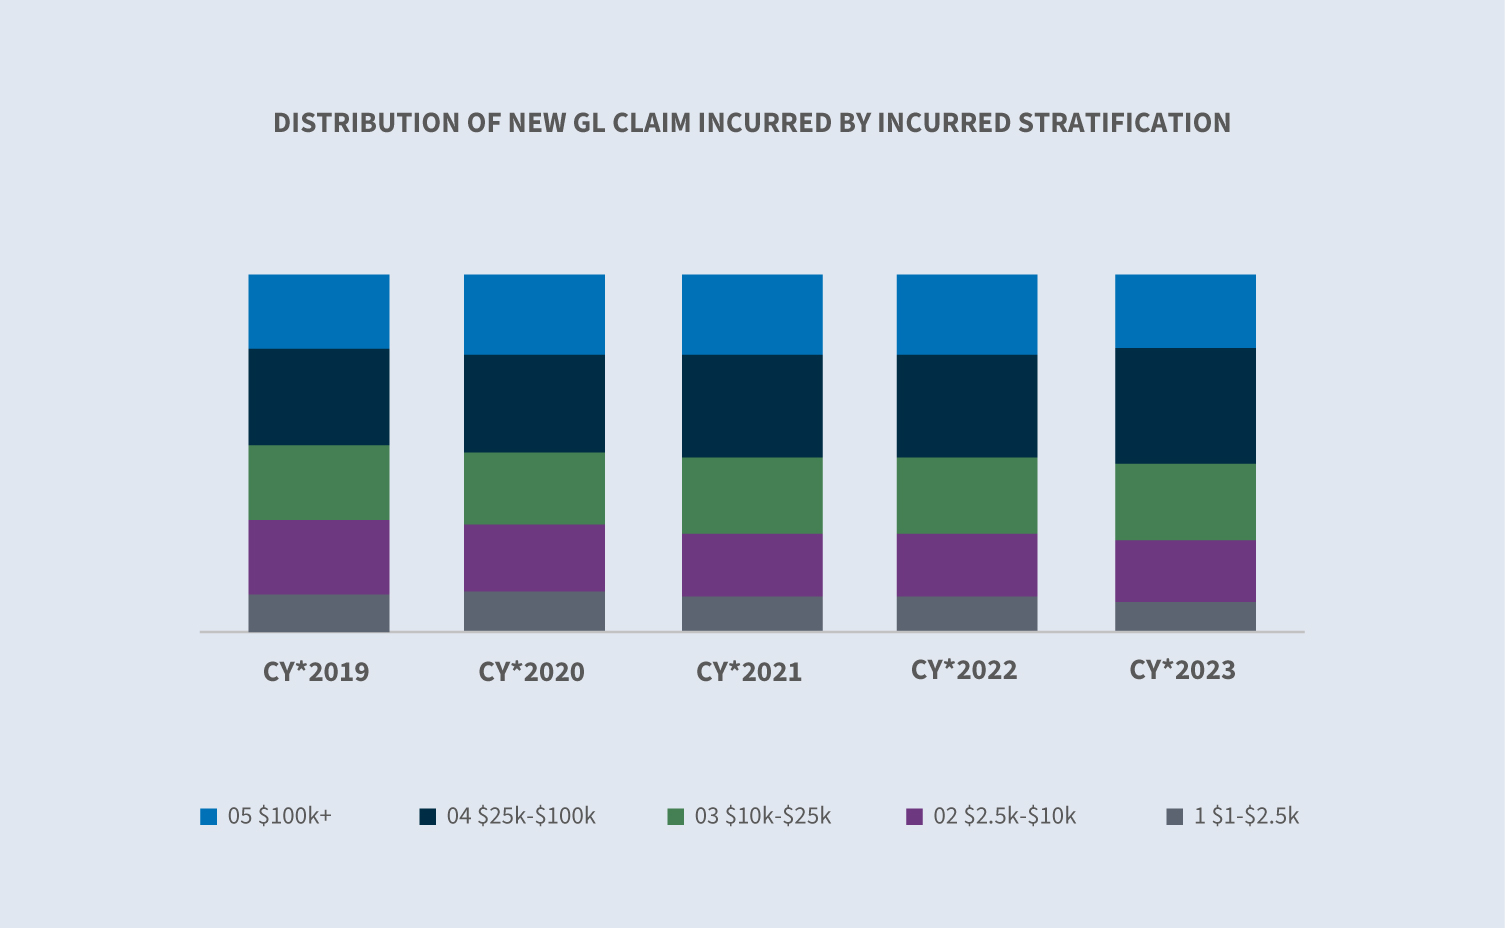
CY 2023 deviated from past year trends in the higher cost categories. CY 2023 claims within the $100K+ category decreased to 21% of the total incurred, whereas the $25K to $100K category increased to 32% of the total incurred. Although costs are still rising, the increase is decelerating to some degree with incurred values pushing down to some extent in CY 2023.
Litigation
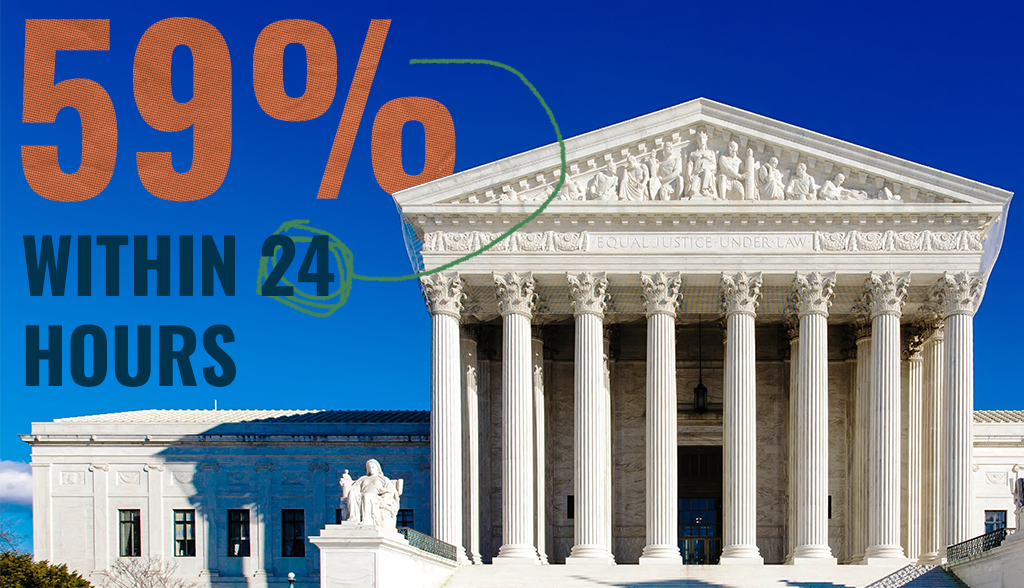
The litigation rate, which had increased to over 1% at midyear, moderated to close CY 2023 at 0.88%. The increase was driven by lawsuits filed in Florida before the March effective date of their tort reform. 59% of all new claims that will at some point involve litigation have attorney representation already in place within the first 24 hours of investigation.

Litigation aged pending has continued to decrease each year since 2019. CY 2023 saw a decrease of 10% over 2022. Overall aged pending decreased 2.5% in CY 2023 to 22.5% — its lowest mark since CY 2020.
Closures
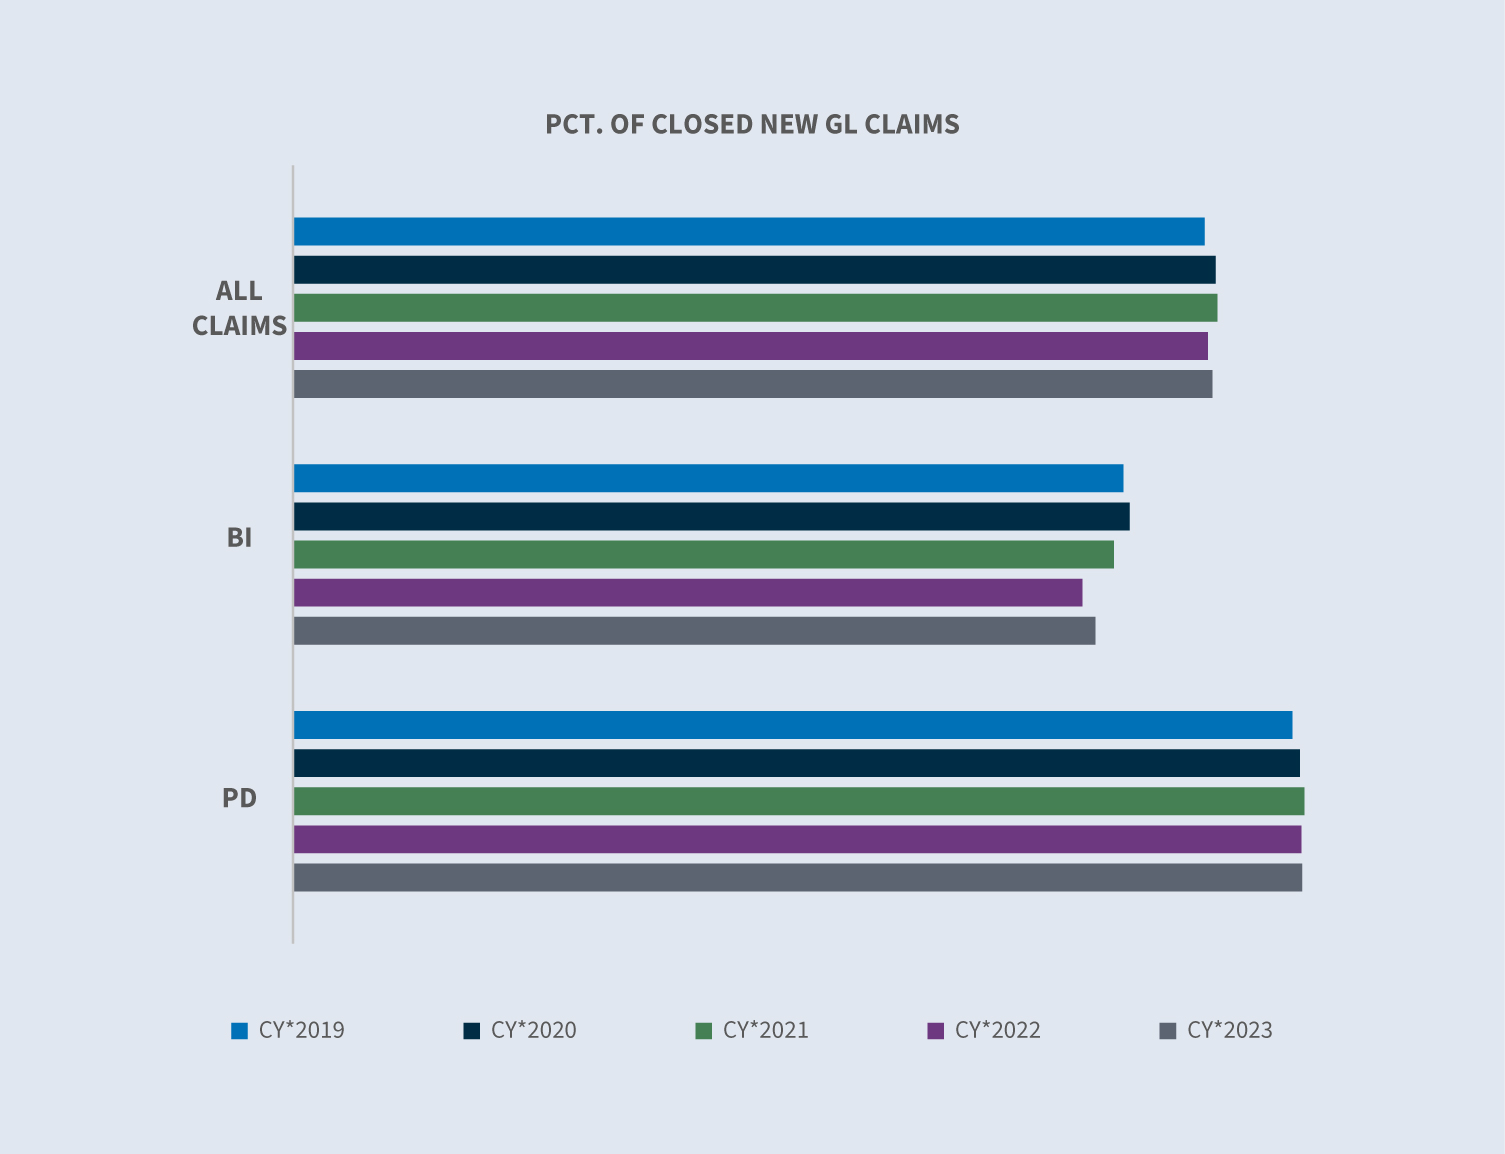
Liability closure rates for new claims for 2023 remained flat in comparison to 2022; however, BI closures increased by 1.5%.
The average duration of all GL claims remained flat, but the duration of GL BI claims was slightly up.
Litigated claims currently represent 5.5% of the total closed claim volume yet account for 63% of the total dollars paid on closed claims. The average paid for a closed litigated claim increased by 6% in CY 2023, influenced primarily by the 20% increase in volume of closed litigated claims. The average paid on non-litigated closed claims decreased 16%. Closed non-litigated claims volume increased 4%.
Future considerations
Sedgwick trends
Both incurred and paid amounts continued to increase in CY 2023. The average incurred increased 12.7% in CY 2023 compared to a 15% increase in CY 2022. The average paid increased by 16.7% in CY 2023.
The litigation rate for GL claims increased to 0.88% — an all-time high for frequency. This increase was driven primarily by the Florida filings triggered by their recent tort reform. The average cost for a closed litigated claim has continued to increase, most recently increasing 5%. The percentage of claims that are litigated earlier, including the number of claims with representation in place before first notice, continues to increase. The cost of non-litigated claims decreased for the first time in several years (-16.5%). The average cost of litigated claims equals 30 times the relative cost of non-litigated claims.
Claims are being litigated sooner — more often with an increasing cost. The cost of larger and litigated claims is growing with the volume of claims in the upper tier cost categories representing a growing portion of the claim distribution. The average incurred costs for claims valued at $100K or less remained flat for CY 2023 in comparison to CY 2022, whereas the average incurred costs for claims valued over $100K decreased 6.4% in CY 2023 in comparison to CY 2022.
Aged pending continues to decrease, reaching a low point of 22.5% in comparison to the last four years. This has been driven primarily by the continued reduction of aged litigated claims decreasing 10% for CY 2023 in comparison to CY 2022.
Industry concerns
Inflation
Inflation continued to decrease in CY 2023 closing the year at 3.4%. However, inflation’s impact on P/C costs is still being reflected to a much higher degree through replacement costs. Between 2020 and 2023, replacement costs increased an average of 45% whereas inflation for the overall U.S. economy increased 15% for that same period (Milliman).
Tort reform
2023 brought back to life the possibility of tort reform as an option to control escalating liability litigation and costs through Florida H.B. 837. One immediate consequence of the reform was an influx of thousands of lawsuits filed by plaintiff’s attorneys prior to the enactment date to ensure application of the old law. This in turn led to an escalation of overall litigation volume, defense attorney’s fees, reserves, litigation expenses and settlements. What would have occurred with a natural flow over several years was compacted into six months, resulting in inconsistent analytical trends. In 2024, we will begin to see the positive aspect of this tort reform.
Active assailant incidents
These incidents are becoming increasingly prevalent across the U.S. In its report for events in 2022, the Department of Justice noted 50 incidents for that year, a 67% increase in comparison to 2018. Adequacy of premises security is the key concept for which business may be held liable for any such event that occurs on their premises. Timely evaluation of active assailant exposures, risk management measures and incident response plans can help ensure all best practices are in place.
Medical expenses
Increasing medical costs will continue to impact liability claim values. The surge in medical expenses is related to increased costs of prescription drugs, elevated treatment due to advancements in medical technology, evolving care methods and rising wages for healthcare workers. It is not expected these escalating costs will abate any time in the near future.
The Judicial Hellholes list
The 2023-2024 list from the American Tort Reform (ATR) Foundation profiles jurisdictions that are known for allowing innovative lawsuits to proceed upon novel legal theories and/or welcoming litigation tourism. ATR notes that in each jurisdiction, “judges in civil cases systematically apply laws and court procedures in an unfair and unbalanced manner, generally to the disadvantage of defendants.” This list comprises:
1. Georgia, Supreme Court of Pennsylvania and the Philadelphia Court of Common Pleas (tied)
4. Cook County, Illinois
5. California
6. New York City
7. South Carolina Asbestos Litigation
8. Lansing, Michigan
9. Louisiana
10. St. Louis
Litigation
Although the cost of liability litigation continued to increase in CY 2023, it was moderated to some degree in comparison to previous years. Four primary areas of concern:
Litigation funding is the process of investors providing capital to plaintiff’s attorneys which allows them to leverage a portion of the future asset of a lawsuit and acquire immediate capital. One recent study estimated that large US commercial litigation funders had a total of $13.5B in assets under management as of 2022. Concerns with litigation funding include increasing the duration of litigated matters, plaintiffs being less inclined to seek resolution in hopes of securing an extreme verdict, and the outsized influence of those not necessary to the litigation process. States are beginning to expand regulation of third-party litigation funding through regulatory and or the legislative process. Only four courts require disclosure of third-party litigation finance: New Jersey and Delaware U.S. District courts and Wisconsin and West Virginia state courts. In September 2023, the US District Judge (Florida) in the 3M multidistrict litigation (earplugs) issued an order specifically prohibiting litigation funding in the matter. This was an extraordinary action yet exemplifies the concerns that litigation funding has on the process.
Social inflation refers to the impact of rising litigation costs on claim payouts, loss ratios, and, ultimately, how much policyholders pay for coverage. Research suggests that social inflation could be causing losses to increase 2% to 3% each year over and above general inflation. Multiple factors are contributing to social inflation within the liability market, including attorney advertising, tort reform deterioration, desensitization to large jury awards and declination of attitudes toward corporations. Juries continue to dictate that when someone is injured, someone else must pay — and that “someone” is inevitably the party perceived to have deep pockets.

Plaintiff bar tactics and novel theories of liability are continuing to drive up claim values. Tactics include jury anchoring, reptile theory and novel theories such as expansion of vicarious liability.
- ∙Jury anchoring: A strategy used to cause jurors to use a specific, often random, point of reference when evaluating damages in a lawsuit. Typically, it includes making references to corporate revenue or income as a means to set a start point for damages.
- ∙Reptile theory: This strategy continues to inflame jury awards nearly 15 years after it’s emergence and requires additional defense planning and preparation driving up litigation costs as well as claim payouts.
- ∙Novel theories of liability for auto claims include expansion of vicarious liability. These novel theories are not getting overturned by appellate courts and require additional legal strategies to overcome.
Nuclear verdicts: Large jury verdicts are continuing to drive up values attributed to liability claims. A recent study by Marathon Strategies found:
- ∙Nuclear verdict amounts increased by 178% compared to the five years prior to the COVID-19 pandemic.
- ∙Court closures interrupted the trend in 2020.
- ∙The sum of nuclear verdicts nearly quadrupled in the two years following 2020, increasing from $4.9 billion to over $18.3 billion in 2022.
- ∙In 2022, the number of nuclear verdicts doubled with the median amount increasing from $21.5 million to $41.1 million.
- ∙There were 20 awards over $100 million and four over $1 billion in 2022.
Using data and predictive analytics and leveraging emerging technologies like telematics is useful in developing overall avoidance and mitigation plans of the initial losses.
Litigation avoidance at the claim stage must continue to be a focus, particularly when recognizing the trend of claims being litigated sooner. Advocacy and timely communication that promotes understanding of the claim process with a resolution focus will help ensure that claims do not become litigated. Additionally, utilization of predictive modeling identifying claims likely to become litigated can prompt an aggressive workflow to push appropriate and timely resolution.
Once a suit is at hand, seek to reach an amicable pretrial settlement. Identifying counsel with the specific knowledge and expertise of the relevant area of law, the jurisdiction and of current plaintiff strategies is foundational to favorable outcomes. Resolve all appropriate cases expediently. Alternative dispute resolution mechanisms generally present fewer volatile forums to reach settlements, and bench trials more often are preferable to jury trials.
If a trial is warranted or unavoidable, specific trial tactics must be undertaken. Ensuring the defense attorney has a defined litigation strategy that encompasses an approach to the known challenges — reptile theory, anchoring, corporate sentiments, etc. — is a must. A different narrative must be created to ensure the best possible outcome.